Day 10: Motion Maps & Constant Acceleration

Physical Science: Motion Maps

Students began by finding the slopes of the lines they graphed on Friday. I’d previously had them find the average speed of each walker, so it was a pretty easy leap to slope means velocity. Next, I had students observe some constant speed buggies and an accelerating, then showed them images I’d made with Motion Shot. That lead nicely into an activity where students produced position vs. time graphs from a motion map to compare an object with a constant speed to one with a changing speed. I’ve done the activity for several years, but this is the first time I felt like students really “got” what the motion map was showing; I think the Motion Shot photos I used were a big factor in that shift.

Blue Buggy 40 cm per sec

Physics: Building the Constant Acceleration Model

Today, students began building the constant acceleration model. We started by reviewing the limitations of the constant velocity model, then I turned them loose to collect data that would allow them to model the motion of a cart down the ramp. My students were great about diving in to play with the equipment in order to come up with a good approach.

IMG_1169

Day 9: Constant Velocity & First Quiz

Today was homecoming, so classes were shorter than usual and students were more energetic than usual, but we still got some science done!

Physical Science: Constant Velocity Graphs

To introduce constant velocity, three students walked down the hall at different speeds while timers measured how long it took them to reach set points. Most students opted to make their graphs in Desmos. On Monday, we’ll find the equations for the lines to get the significance of the slope.

graph

Physics: First Quiz & Intro to CER

Students took their first quiz of the year. This is my first year using standards-based grading, and I was pleasantly surprised at how fast and easy it was to settle on a grade with only three possible scores, which meant I could focus on providing quality, growth-oriented feedback. After the quiz, students got into small groups to work through some TIPERs questions. I used the questions to introduce the Claim-Evidence-Reasoning framework, which I’m planning use quite a bit this year.

Day 8: First Quiz & Mistakes Game

Physical Science: First Quiz

Students took their first quiz today. I’ve decided to move away from big unit tests in favor of short, frequent assessments. We now have a school-wide policy requiring at least one retake opportunity on all assessments, so I tried to really focus on providing feedback, not grades on the quizzes. It made me feel really optimistic, and I hope my students can find some of the same optimism.

Physics: Mistakes Game

Students played Kelly O’Shea’s mistakes game using some representations of constant velocity. Students got into it and the mistakes they picked showed a lot of common errors. One group got creative with units; the problem didn’t specify, so they decided to use liters per second, explaining that the object was traveling over a body of water with a constant depth. There’s some room to improve on the questions students were asking, but I had a lot of students very willing to speak up and I’m sure they’ll rise to the challenge if I make it a priority.  

Day 7: Bouncy Balls & Velocity vs. Time Graphs

Physical Science: Bouncy Ball Energy

Students measured the rebound height of bouncy balls, ping pong balls, golf balls, and whatever else the science department had around and used conservation of energy to describe their behavior.

IMG_1160

Physics: Velocity vs. Time Graphs

Students started to really dig into velocity vs. time graphs today using a worksheet from the Modeling Instruction materials. Once they finished, they prepared whiteboards for Kelly O’Shea’s mistakes game. Tomorrow, students will present and discuss their whiteboards. Looking over the whiteboards, it looks like my students came up with some mistakes that will lead to nice discussion. I’m also really excited to get to the significance of the area under a velocity vs. time graph. During the Dueling Buggies practical, some of my students were really intrigued by the variety of possible solutions and really studied a bunch of other groups’ whiteboards. They realized that the one representation of constant velocity we’ve used that did not appear on any whiteboard was the velocity vs. time graph. This lead a group of students to try to figure out how they could use the velocity vs. time graph to find when the buggies would collide. I think after we go over the problems tomorrow, they’ll be ready to try it!

Day 6: More Bar Charts & Dueling Buggies

Physical Science: More Energy Bar Charts

I started by putting students into new groups. Since we were going to spend the class period revisiting things they had done previously, I wanted students to work with new people to get a new perspective. We took some time to go over the energy bar charts students had made on Friday. Each group whiteboarded one problem, then presented to the class. Next, we revisited the PhET skate park activity from yesterday. Students shared their predictions for what the bar charts would look like in various scenarios, then came to a group consensus before we used the simulation to actually test their predictions.

IMG_1155

Physics: Dueling Buggies

Today was Dueling Buggies! I’ve been emphasizing position vs. time graphs, so I wasn’t surprised that a lot of students went that direction. There were a lot of other interesting solutions, though. One of my favorites was a group who added the speeds of the two buggies, then divided the initial distance between the buggies by the combined speed to get the collision time, which allowed them to find the position. I was pleased to see that students were intrigued by the variety of solutions, and several wanted to talk to groups who’d done things differently after they turned in their whiteboards. Students also readily recognized that every group had a useful approach since every group made an accurate prediction.

whiteboard2

Day 5: Energy Conservation & Motion Maps

I forgot to take pictures during class today, so words will have to do.

Physical Science: PhET Energy Conservation

After going over the definitions students worked on Friday, we went back to the PhET skate park simulation to look more specifically at energy conservation. I had several different scenarios where I asked students to predict what the energy bar charts would look like for key positions of the skater. The plan was for students to then check each of their predictions using the simulation, but very few groups got to that point thanks to assorted tech issues. I overheard some great conversations where students were really digging into the definitions of the different types of energy along with the details of the skater’s motion to not only make predictions, but find evidence to make supporting arguments. Since it can be tricky to get computer access, I’m planning to project the simulation tomorrow to test the predictions as a class.

Physics: Intro to Motion Maps

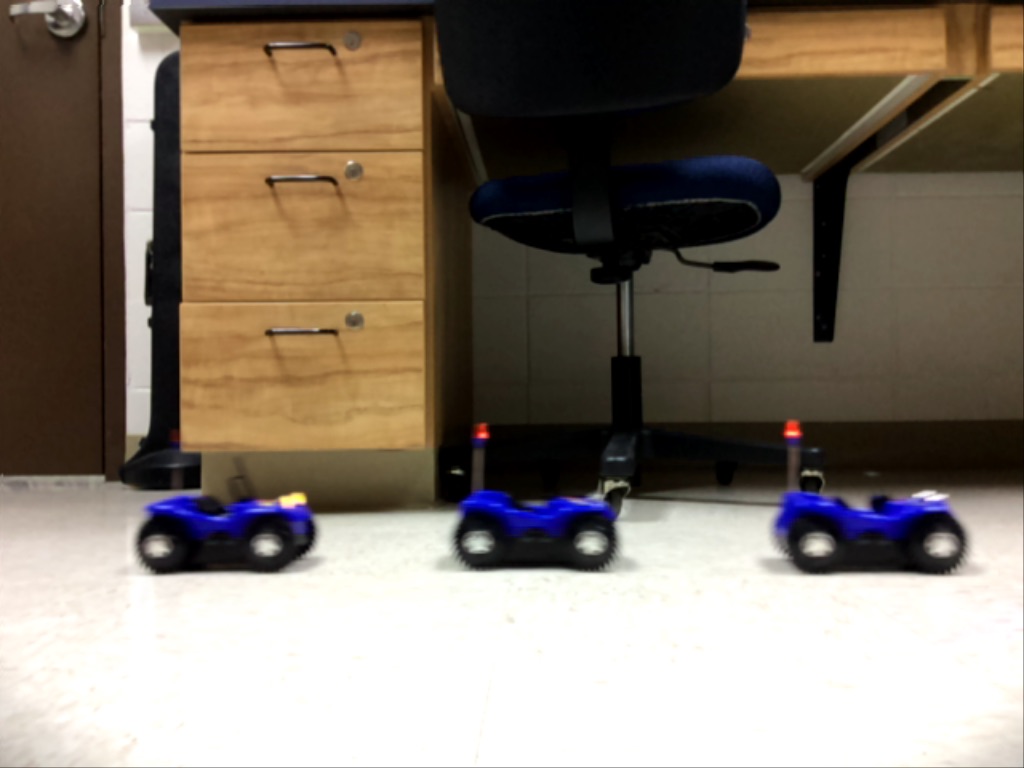
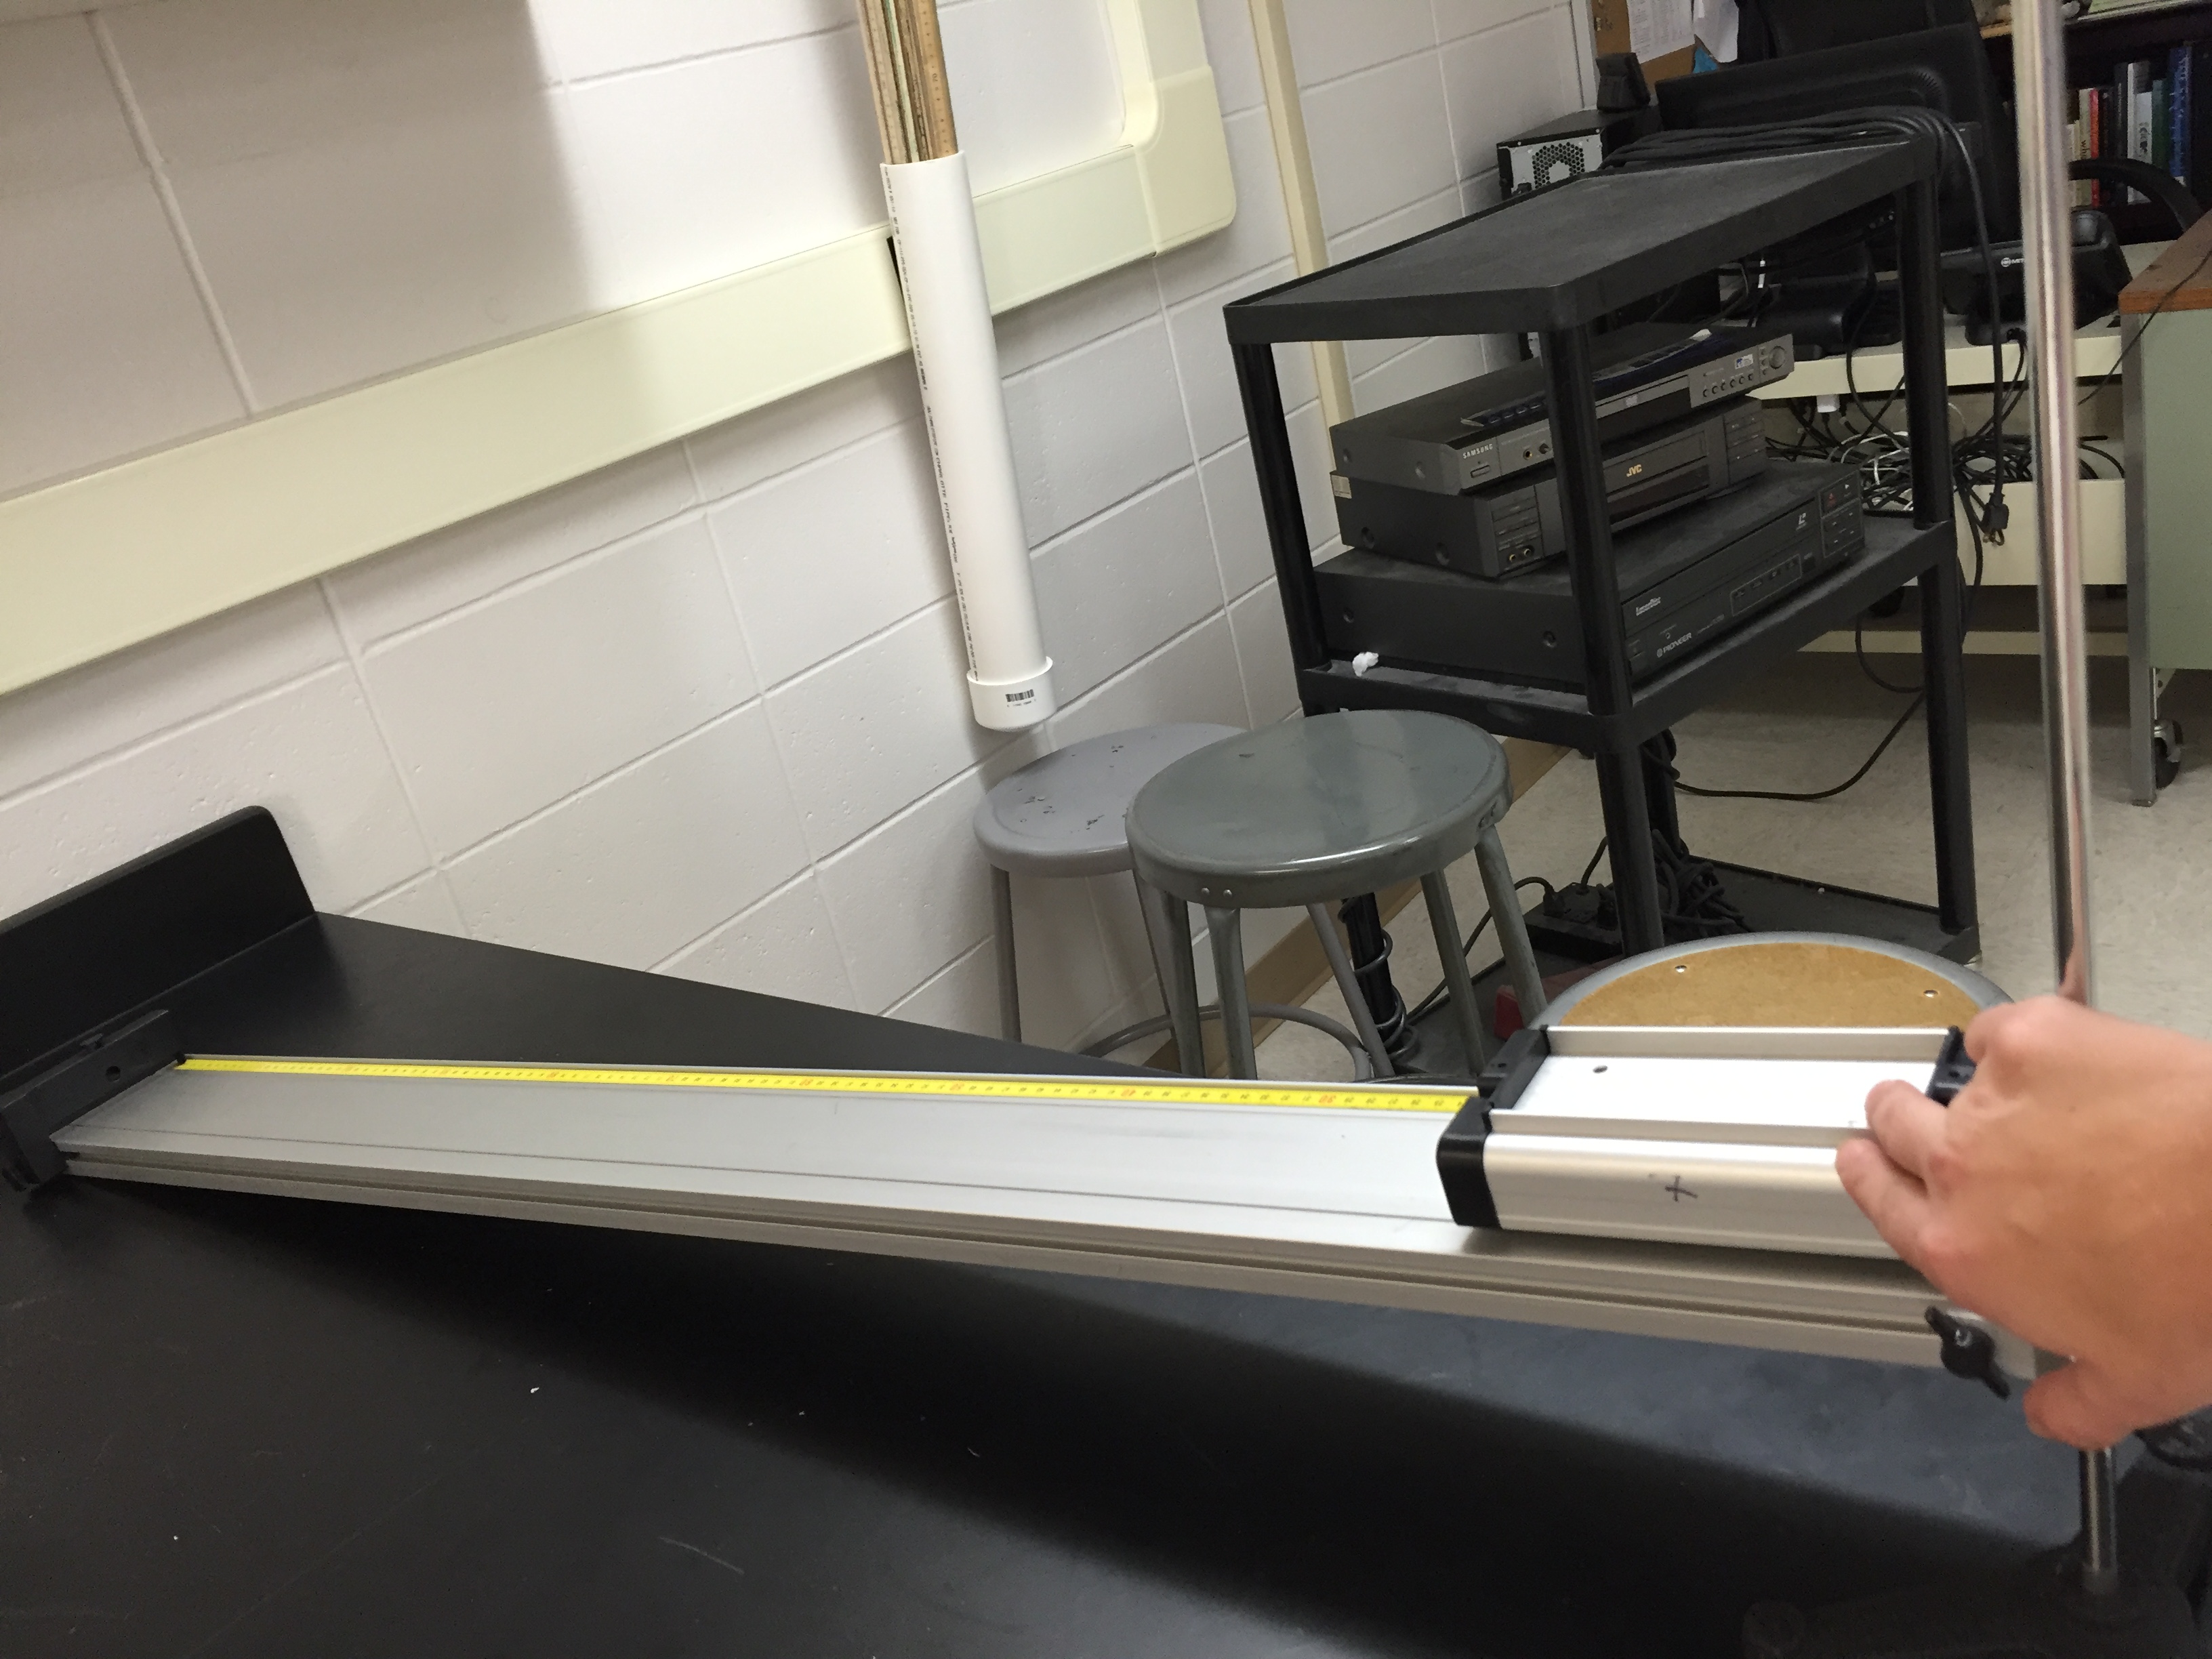
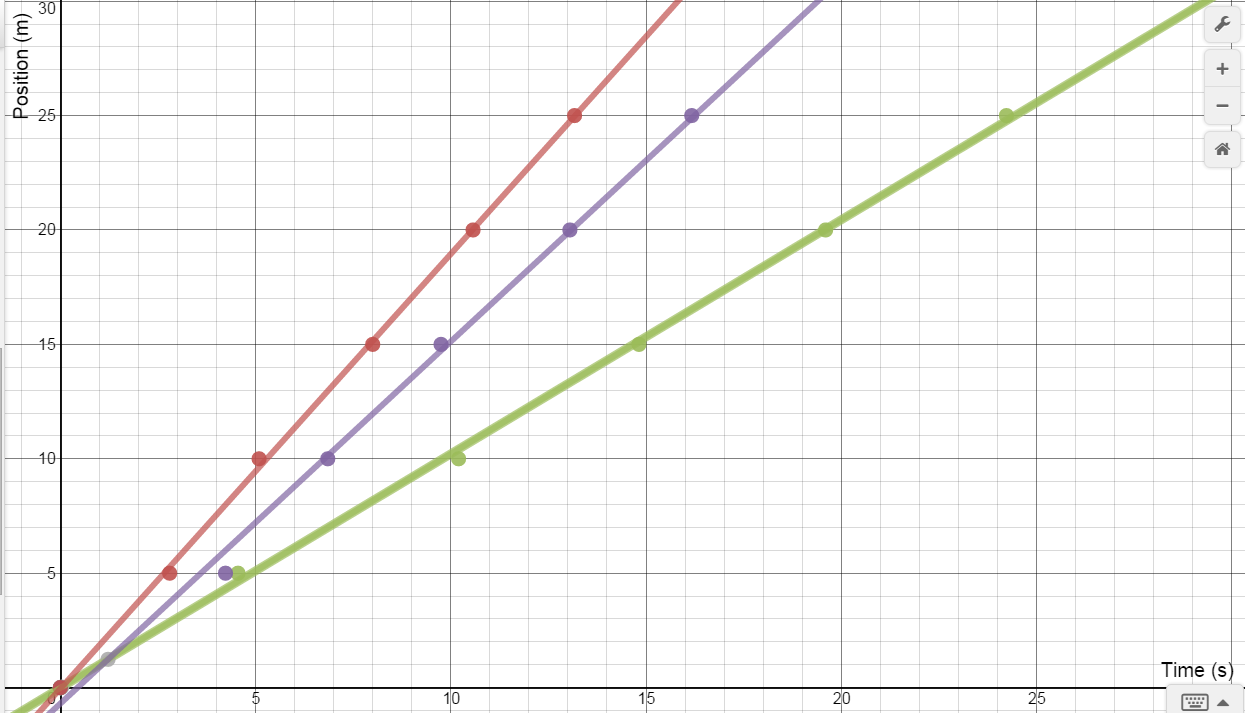
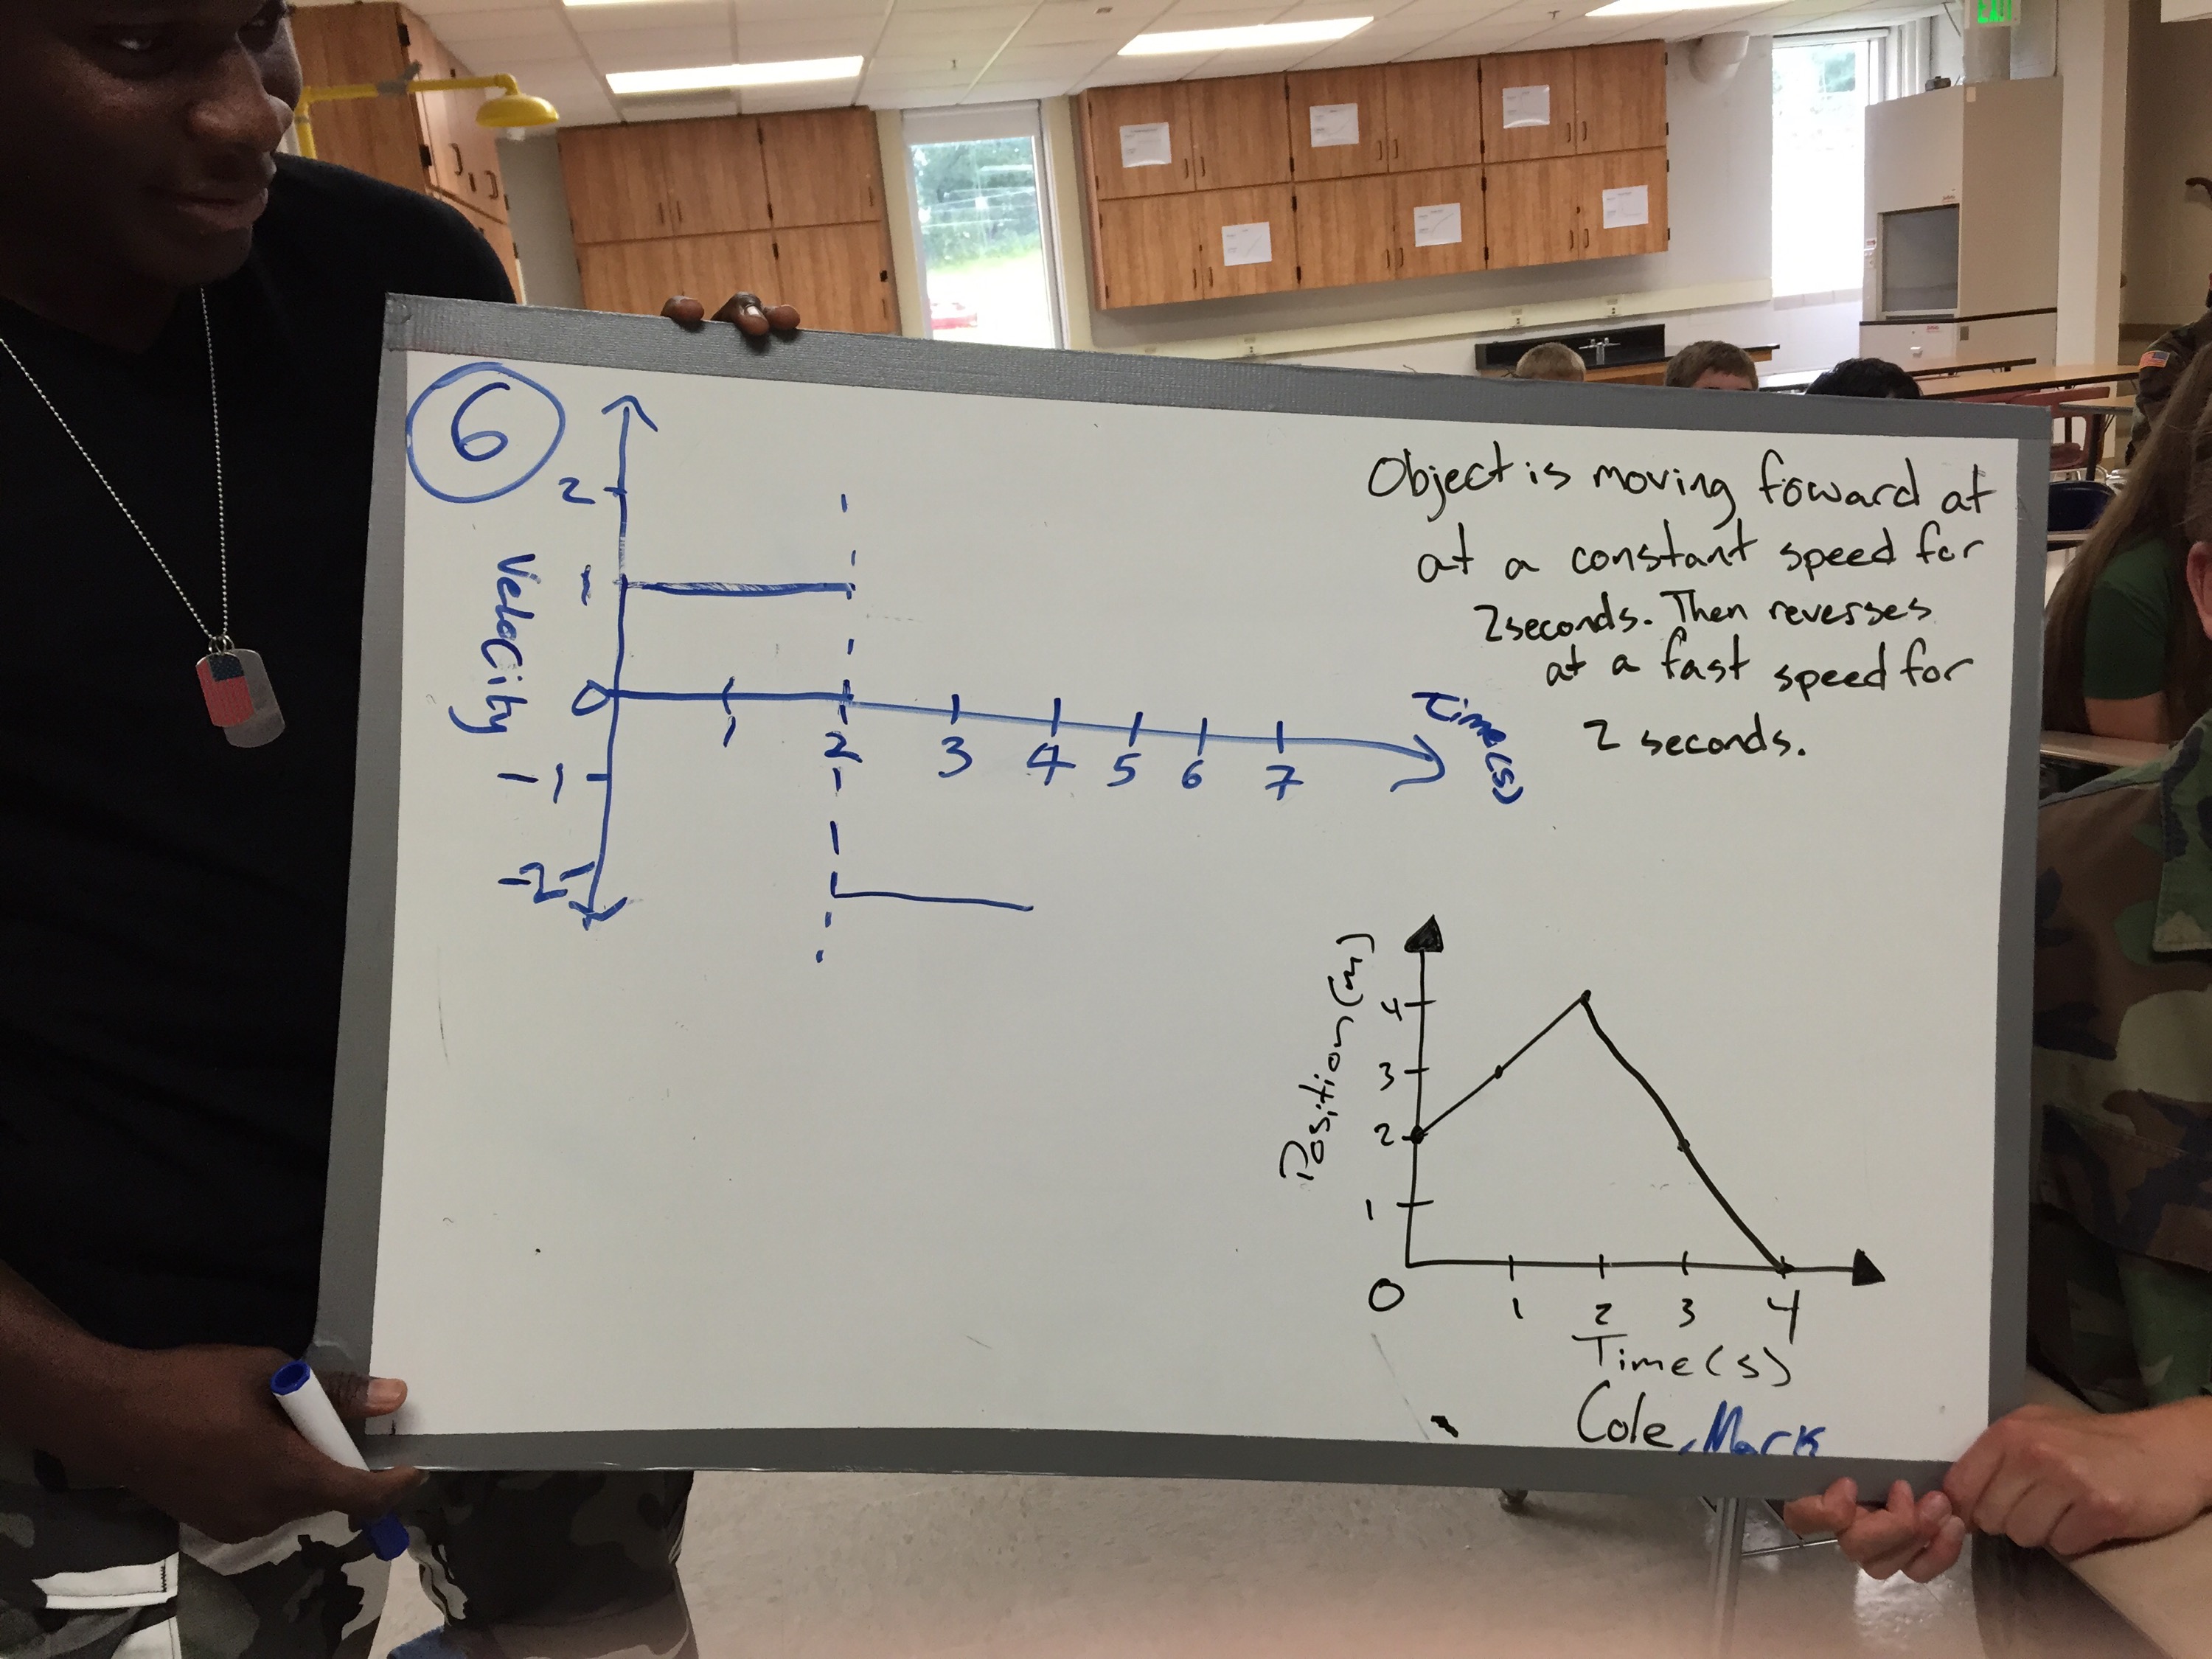
Today students added motion maps to their representations of the constant velocity model and practiced translating between representations using the motion detector lab from the Modeling Instruction materials. Once they got rolling, most of my students seemed to get comfortable with this new representation pretty quickly. I think I drove a few of them a little nuts, though. Inevitably, students came up to me to ask if their answers were right and, rather than just saying yes or no, I tried to stick to asking questions about their representations. My goal during class is always to get students to think harder than me (at least about the physics), so I want to get them to analyze any work they aren’t confident about, even if their answer is already perfect. The trick is they’re used to only being asked to think about their wrong answers, so as soon as I started questioning a lot of students panicked and assumed they were way off. I started prefacing each conversation with a reminder that I was asking questions because I wanted to understand their thinking, not necessarily because their result was wrong. That little reminder seemed to help a lot of students to focus on what I was asking rather than immediately start searching for their mistake, which I think made the conversations more valuable even when their was a mistake for the student to find. I’m sure that as students get used to being asked to explain their thinking (and I get better at probing for their reasoning), the instinct to panic and start searching for the error will fade.

Day 3: Defining Types of Energy & First Board Meeting

Physical Science: Energy Types

Students used PhET’s Energy Skate Park sim to begin exploring energy. Their directions were to open up the bar graph, then find as many ways as they could to change the size of each bar. Tomorrow, their observations will lead into the definitions for kinetic and potential energy.

Energy skate park screenshot

PhET’s Energy Skate Park

Physics: First Board Meeting

Students prepped whiteboards with their results from the Buggy Lab, then we had our first board meeting. I talked more than I wanted to during the meeting, partly because I was rushing to get students ready for a sub tomorrow and partly because I didn’t take enough time to set expectations or let students pre-discuss in smaller groups. Next time, I want to try using Casey Rutherford’s Observations, Claims, & Evidence structure to provide students with a little more scaffolding. My students were very willing to speak up and take risks during the board meetings, so I’m excited to see how future ones go!

Student whiteboard

Student whiteboard

IMG_0198

Another student whiteboard

Day 2: Groupwork Norms & Buggy Lab

Physical Science: Groupwork Norms

As a follow up to yesterday’s Marshmallow Challenge, we had some discussion about the importance of mistakes and revision in building a tower, then compared that to learning science. Groups also reflected on what they did that helped them work together effectively. Those reflections lead to class-wide norms for group work. One suggestion was “Don’t copy someone else’s epic fails”; it got edited to “Learn from others’ mistakes”, but a piece of me wishes we’d kept the original wording.

Physics: Buggy Lab

Students collected data with the constant speed buggies based on the procedures groups planned yesterday. Just about every group ran into at least one issue that forced them to rethink the details of their approach. That lead to some great conversations within groups about balancing ideal data collection against what’s possible in the lab, including what makes data “good enough.” 

Day 1: Marshmallow Challenge & Buggy Intro

Physical Science: Marshmallow Challenge

Students did Tom Wujec’s Marshmallow Challenge. Tomorrow, we’ll debrief with a discussion about the importance of seeing what doesn’t work and what makes an effective group.

Marshmallow Challenge

Marshmallow Challenge

Physics: Intro to Buggies

We discussed “what is physics?”, emphasizing the importance of physics as a process. Next, we got out the buggies to make a list of what we could observe and what we could measure. In the process, we defined a constant speed as traveling the same distance in each unit of time.