Physical Science: More Energy Bar Charts
I started by putting students into new groups. Since we were going to spend the class period revisiting things they had done previously, I wanted students to work with new people to get a new perspective. We took some time to go over the energy bar charts students had made on Friday. Each group whiteboarded one problem, then presented to the class. Next, we revisited the PhET skate park activity from yesterday. Students shared their predictions for what the bar charts would look like in various scenarios, then came to a group consensus before we used the simulation to actually test their predictions.

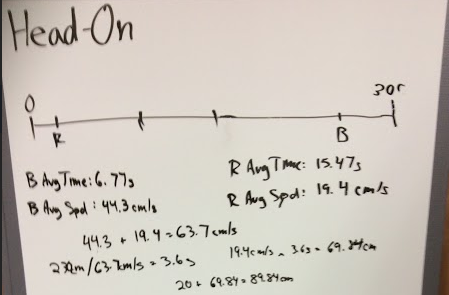
Physics: Dueling Buggies
Today was Dueling Buggies! I’ve been emphasizing position vs. time graphs, so I wasn’t surprised that a lot of students went that direction. There were a lot of other interesting solutions, though. One of my favorites was a group who added the speeds of the two buggies, then divided the initial distance between the buggies by the combined speed to get the collision time, which allowed them to find the position. I was pleased to see that students were intrigued by the variety of solutions, and several wanted to talk to groups who’d done things differently after they turned in their whiteboards. Students also readily recognized that every group had a useful approach since every group made an accurate prediction.