Day 80: Big Pendulum, Mistakes Game, & Phase Change

Classes were short today so we could work with our homerooms on registration for next year.

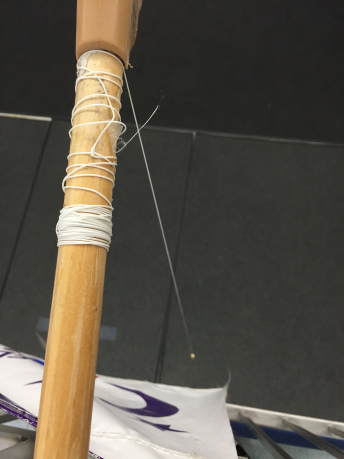
AP Physics: Big Pendulum

After a quiz, we went to the front entrance to measure the period of a 5 m long pendulum so students could see how well their model so far fits the result before tomorrow’s board meeting. I’m hoping the period of this pendulum will push students to try linearizing their data.

pendulum big

Physics: Mistakes Game

We did some mistakes whiteboarding with energy bar charts. One of my AVID students commented that it reminds her of AVID tutorials, which is spot on. I also had a group tell the class “If you need a hint, you should read the problem”, and I took the opportunity to point out that is always good advice.

Chemistry Essentials: Phase Change

Students graphed their data and we started talking about the results of the phase change lab. Last tri, when I let students have one group member put the data into Desmos, I found that the rest of the group would typically ignore the graph, so I had every student graph by hand today. while students paid more attention to the shape of their graph, it was pretty laborious so I want to keep thinking about how to approach the graph for this lab.

desmos-graph (1).png

Day 79: Pendulums, LOLs, & Phase Change

AP Physics: Pendulums

Students continued data collection and analysis for their pendulum lab. Today, I added that they need to predict the period of a roughly 5 m long pendulum we can hang in the front entrance, which drove some groups to get the longest pendulums they could at their lab tables. I had some groups try to use their formula sheets to calculate the period, rather than extrapolate from their data, but struggled to differentiate between the three formulas for period listed.

pend.jpg

One solution for measuring angle

Physics: LOL Diagrams

Students whiteboarded the first part of the problems from Friday. In the section that had a sub, the majority of students did not attempt the problems and said it was because they were too confusing. I’m planning to spend some time tomorrow discussing general strategies for moving forward on a confusing problem.

lol.jpg

Chemistry Essentials: Phase Change

Students collected temperature vs. time data for heating up ice to boiling. Glancing at the numbers, I think most students will have pretty good results. Several groups called me over to say it wasn’t working since they didn’t have much temperature change at the beginning.

phase change.jpg

Day 34: Board Meeting, CAPM Practical, & Freezing Acid

AP Physics: Board Meeting

We had a board meeting to wrap up the buggy lab. A lot of students who are normally quiet in whole class discussions spoke up today, which was great. In addition, there were some interesting observations that don’t always come up, like the student who commented the intercept did not depend on the slope. At the end of the hour, I also asked groups to whiteboard a CER for what the momentum vs. time graph should look like and, while we didn’t have a chance to discuss the boards, groups consistently were on the right track and not only connected the buggy lab to the definition of momentum, but to Newton’s 1st Law by discussing whether they could identify unbalanced forces on the buggy.

buggy wb

Physics: CAPM Practical

Students started working on a constant acceleration lab practical where they try to get a marble rolling down a ramp to land in a cup attached to a moving buggy. Some groups got a starting position for the marble while others got a starting position for the buggy. A lot of groups had trouble focusing on individual pieces of the task; tomorrow, I may take a few minutes to talk through the major steps students need to take. I’m also seeing students continue to struggle with confidence; they are nailing the problems, but just don’t believe that they get it, which makes it difficult to approach a challenging lab practical.

marble

Chemistry Essentials: Freezing Acid

We discussed the results of yesterday’s lab. At the end of the hour yesterday, a lot of students didn’t seem convinced that temperature stays constant during a phase change, partly because they were focusing on their data tables and saw very small temperature variations. Today, I projected a graph from one of the groups for the discussion, and students saw much more clearly that the temperature is pretty constant. When students graph in Desmos, I usually allow one group member to make a graph as long as everyone sketches it (I don’t have a good way for students to print), but I think that’s making it too easy for most of the group to just glance at the graph so I need to work on ways to get students looking closer. I usually have a handout for labs in this course, so I’ll probably add some questions to prompt students to look carefully at their group’s graph to the next lab to see if that helps.

desmos-graph

Day 33: Buggies, Problems, & Freezing Acid

AP Physics: Buggies

Students collected data to produce position vs. time graphs for a buggy travelling at a constant speed. While I really like this lab for the start of the year, it was fun to see a group that has a pretty strong class culture and is developing some good skills tackles a fairly easy lab like this one. My students were also SUPER excited about the buggies; I don’t think I’ve ever had students who were so into them.

buggy (1)

Physics: CAPM Problems

Students worked on another problem set to practice constant acceleration. We’re at a point where a lot of students are getting it and just doing more problems won’t get them there, so its time to move on.

Chemistry Essentials: Freezing Acid

Students made temperature vs. time graphs for freezing lauric acid. A lot of students are still not convinced that the temperature stays constant during a phase change, so I’ll need to make sure we spend some time going over the graphs tomorrow.

chem lauric.jpg

Day 32: Whiteboarding Galore

Between having a sub on Wednesday and no school on Thursday or Friday, today was all about getting my classes back on track.

AP Physics: Conservation of Momentum Problems

Students whiteboarded the conservation of momentum problems from last Tuesday. Many of the problems require students to shift between thinking about the system as a whole and thinking about individual objects, and interaction diagrams (or system schema) proved to be incredibly powerful tools. The first year I used the Modeling Instruction curriculum, I didn’t quite get them and, as a result, my students never really saw the value, but my students and I are now huge fans.

interaction.jpg

Physics: Constant Acceleration Problems

On Wednesday, I left my students some problems that included several that started with graphs they’d already sketched and annotated. My students admitted that they made very little progress on Wednesday, partly because they got confused and shut down. This has been pretty common with my students this year, so we spent some time discussing alternative strategies for when they are stuck. Afterward, students whiteboarded the problems for a gallery walk. They are making good progress on connecting the features of the graph to the physical meaning it represents.

phys graph soln.jpg

Chemistry Essentials: Phase Change Bar Charts

On Wednesday, students watched a short video lecture where I talked about the results of Tuesday’s phase change lab and introduced energy bar charts. While students got nice graphs from the lab, they were confused by the video lecture, so we spent most of the hour discussing it. It turns out the main issue is we haven’t spent much time on what the particles are doing during a phase change, so they weren’t willing to accept that explanation for the constant temperature in the lab without some additional convincing. I fired up a PhET simulation, which seemed to fill in some of the necessary gaps and allowed students to take a much more successful second shot at Wednesday’s bar chart problems.

phase change phet.PNG

Day 31: Multiple Choice, Problems, & Bar Charts

I was home sick today, so wasn’t able to take any photos.

AP Physics: Multiple Choice

Students worked on some multiple choice problems off practice AP exams. I usually have students answer individually with Plickers, then talk to each other and answer again before we have some whole-class discussion.  To try and replicate that, I gave students two spaces to answer the questions so they can do all of them individually, then talk about each one with their group. I put in my notes to have some whole-class discussion about the answers at the end, which I’ll be curious to hear how it goes.

Physics: Problems

Students took the plunge to start calculations  with constant acceleration. As part of their worksheet annotating graphs, I had students sketch and annotate v-t graphs given just the statement part of some of today’s problems. I’ll be curious to see if that is a useful bridge.

Chemistry Essentials: Bar Charts

Students worked on some bar charts for objects heating up and going through phase changes. We ran out of time to discuss the lab, so I ended up recording a video lecture that gives away the big ideas from the lab.

Day 30: Problems, Annotating Graphs, & Boiling Ice

AP Physics: Problems

Students worked on some conservation of momentum problems. When students asked for help, I could tell pretty quickly who had sketched interaction diagrams. Especially now that I’m embedding center of mass, they have become an incredibly powerful tool. I also demonstrated exploding carts on a balanced track and was pleased at how easily students used the center of mass of the system to explain why it stayed balanced, even when the carts had different masses.


Physics: Annotating Graphs

Students whiteboarded their solutions to yesterday’s problems. I’m pleased to see a lot of students starting to make sense of the physical meaning of the graphs. I was surprised by some students who struggled to differentiate between initial velocity and maximum velocity, but I think they were able to clear up their confusion by the end of the hour.

graph soln

Chemistry Essentials: Boiling Ice

Students recorded temperatures as ice melted and eventually boiled. A lot of students where quick to say their results didn’t make sense when they saw minimal temperature changes during the phase changes, which was great.

ice melting.jpg