Day 59: Energy Introduction & Conservation of Mass

Physics: Energy Introduction

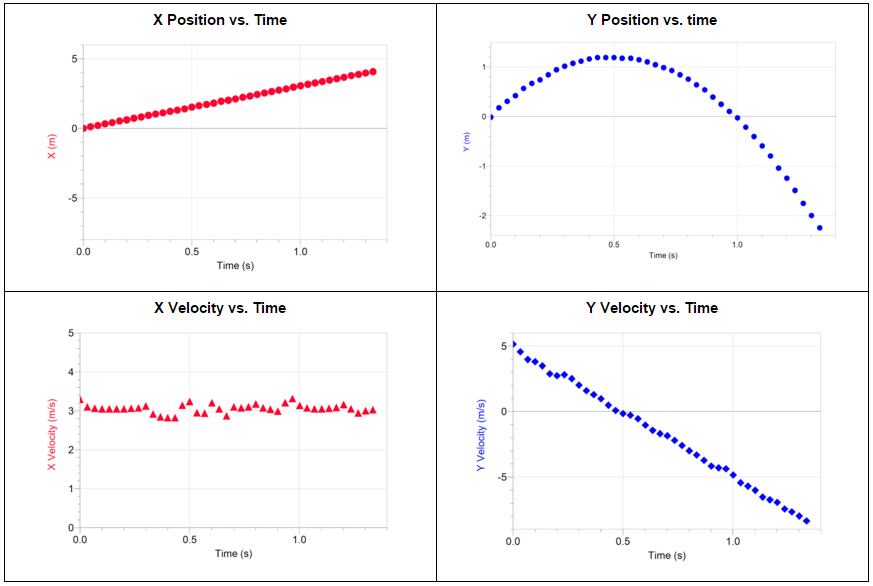
To introduce energy, we used a lab my colleague has done in the past. Students dropped a steel ball into a bucket of sand and measure the depth of the crater. I haven’t told my students yet, but we’re using the crater depth as a proxy for energy, similar to the “chalk-smashing ability” in Etkina’s PUM curriculum. Students collected data and graphed to get a relationship between the crater depth and the drop height, which we’ll use tomorrow to help define gravitational potential energy. I also had students use free fall to calculate the impact speed of the ball and graph the relationship between crater depth and impact speed, which will lead to the definition of kinetic energy.

IMG_1506

Chemistry: Conservation of Mass

This trimester, instead of teaching 9th grade physical science, I’m teaching the second half of a course called Chemistry Essentials. This two trimester course meets the minimum graduation requirements for my district. Most of the students tend to struggle in school, for a wide variety of reasons, and there is a high percentage of students who qualify for special education services.

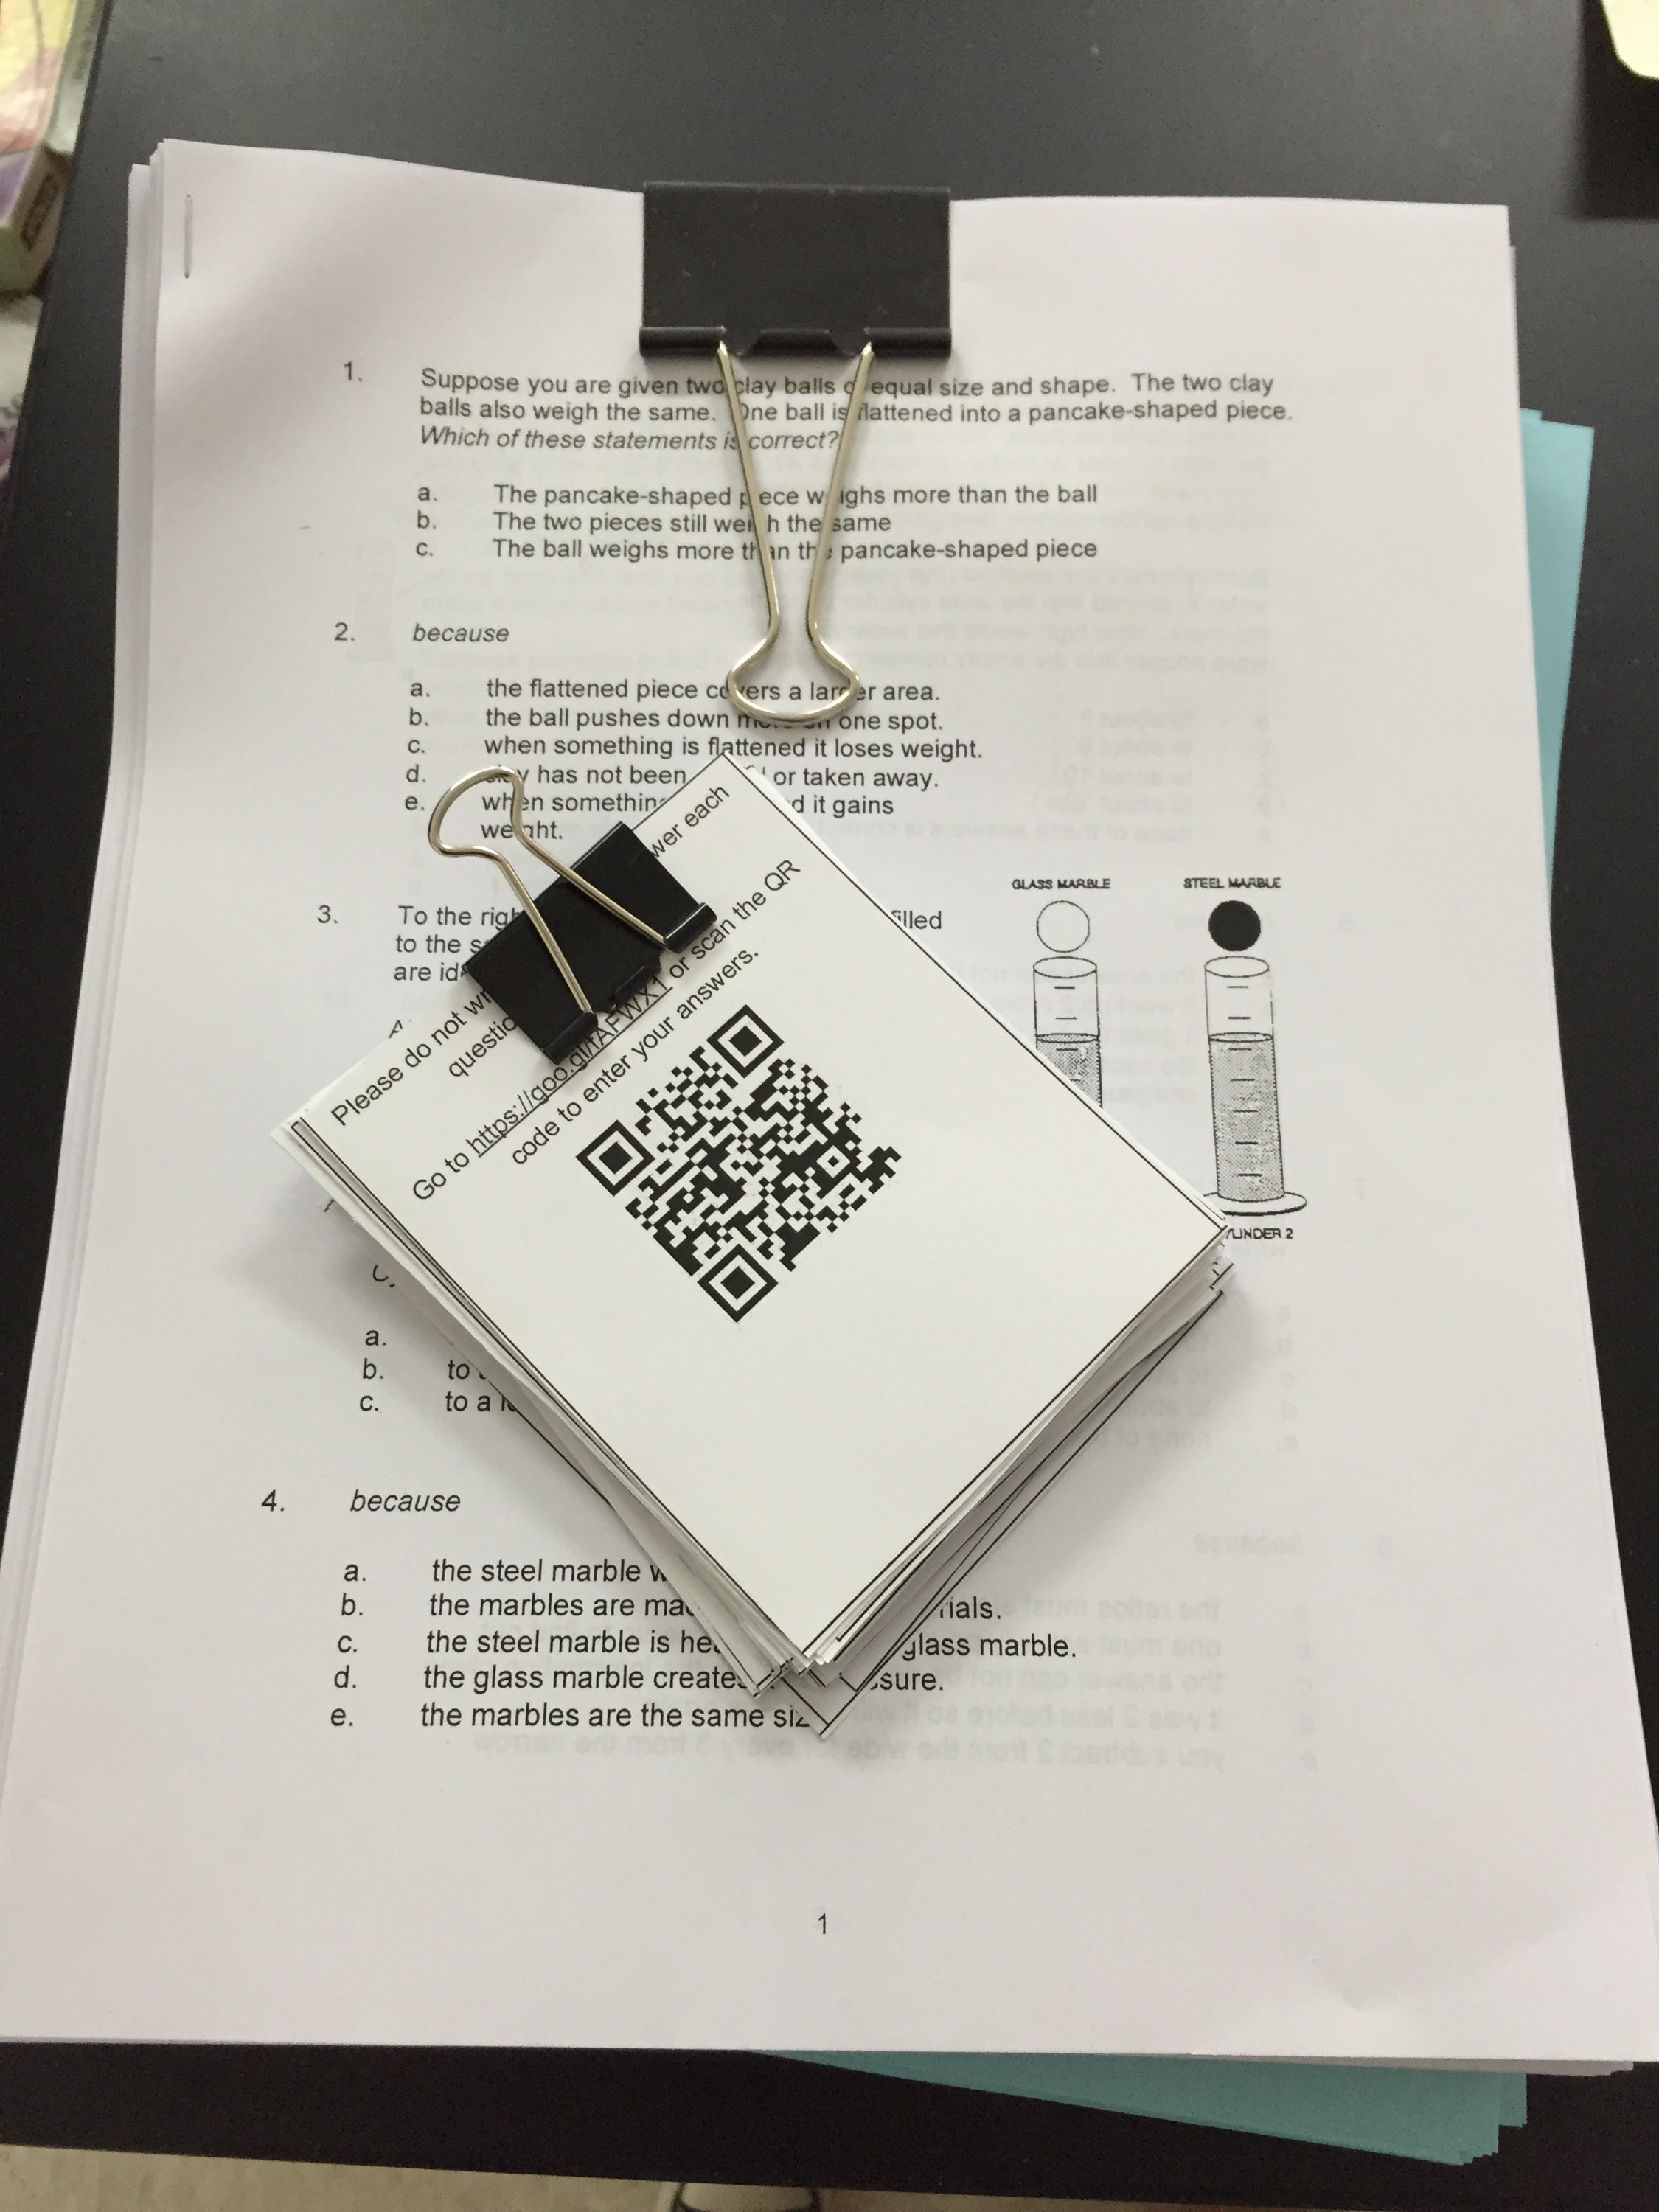
The first unit deals with writing and balancing chemical equations, so I decided to start with conservation of mass. Students put calcium chloride, sodium bicarbonate, and bromothymol blue into a sealed plastic bag, tracking the mass of everything involved. Once the reaction was finished, they measured the mass of the bag and its contents and found the total mass had stayed the same. I also had them measure the mass after removing as much gas as possible. The main issue was students had some trouble getting the plastic bag all the way on the pan of the balance, which impacted the mass they measured at the end. Next time, I’ll try having students set their bag in a rigid container like a beaker to get the total mass.

IMG_1508

Day 42: Energy Position Project & Projectile Motion

Physical Science: Energy Position Project

Students started a research project on different energy sources. As part of the project, students have to develop a support an opinion on their energy source. At the end of next week, students will give a presentation to the rest of the class on their energy source.

Physics: Projectile Motion

We finally got Logger Pro installed on a netbook cart for students to use, so I had grand plans of teaching my students to use Logger Pro’s video analysis so they could generate position vs. time and velocity vs. time graphs of videos they’d recorded. But I made the mistake of not testing the netbooks before class and found out the hard way that, while everything works just fine on the school’s desktop computers, our netbooks use an old version of Quicktime, which means no viewing videos in Logger Pro.

In my second hour, I had students record some video tossing softballs and tennis balls at different angles. For my fourth hour, I used my prep to do some analysis of one of Vernier’s sample videos and gave my students the graphs and some conceptual questions. Our tech guy spent the afternoon updating Quicktime on the netbook cart, so I’ll probably have my students do some video analysis tomorrow.

Projectile Graphs

Day 6: More Bar Charts & Dueling Buggies

Physical Science: More Energy Bar Charts

I started by putting students into new groups. Since we were going to spend the class period revisiting things they had done previously, I wanted students to work with new people to get a new perspective. We took some time to go over the energy bar charts students had made on Friday. Each group whiteboarded one problem, then presented to the class. Next, we revisited the PhET skate park activity from yesterday. Students shared their predictions for what the bar charts would look like in various scenarios, then came to a group consensus before we used the simulation to actually test their predictions.

IMG_1155

Physics: Dueling Buggies

Today was Dueling Buggies! I’ve been emphasizing position vs. time graphs, so I wasn’t surprised that a lot of students went that direction. There were a lot of other interesting solutions, though. One of my favorites was a group who added the speeds of the two buggies, then divided the initial distance between the buggies by the combined speed to get the collision time, which allowed them to find the position. I was pleased to see that students were intrigued by the variety of solutions, and several wanted to talk to groups who’d done things differently after they turned in their whiteboards. Students also readily recognized that every group had a useful approach since every group made an accurate prediction.

whiteboard2

Day 5: Energy Conservation & Motion Maps

I forgot to take pictures during class today, so words will have to do.

Physical Science: PhET Energy Conservation

After going over the definitions students worked on Friday, we went back to the PhET skate park simulation to look more specifically at energy conservation. I had several different scenarios where I asked students to predict what the energy bar charts would look like for key positions of the skater. The plan was for students to then check each of their predictions using the simulation, but very few groups got to that point thanks to assorted tech issues. I overheard some great conversations where students were really digging into the definitions of the different types of energy along with the details of the skater’s motion to not only make predictions, but find evidence to make supporting arguments. Since it can be tricky to get computer access, I’m planning to project the simulation tomorrow to test the predictions as a class.

Physics: Intro to Motion Maps

Today students added motion maps to their representations of the constant velocity model and practiced translating between representations using the motion detector lab from the Modeling Instruction materials. Once they got rolling, most of my students seemed to get comfortable with this new representation pretty quickly. I think I drove a few of them a little nuts, though. Inevitably, students came up to me to ask if their answers were right and, rather than just saying yes or no, I tried to stick to asking questions about their representations. My goal during class is always to get students to think harder than me (at least about the physics), so I want to get them to analyze any work they aren’t confident about, even if their answer is already perfect. The trick is they’re used to only being asked to think about their wrong answers, so as soon as I started questioning a lot of students panicked and assumed they were way off. I started prefacing each conversation with a reminder that I was asking questions because I wanted to understand their thinking, not necessarily because their result was wrong. That little reminder seemed to help a lot of students to focus on what I was asking rather than immediately start searching for their mistake, which I think made the conversations more valuable even when their was a mistake for the student to find. I’m sure that as students get used to being asked to explain their thinking (and I get better at probing for their reasoning), the instinct to panic and start searching for the error will fade.

Day 4: Bar Charts & CTSR

My sister is getting married this weekend, so today was my first sub of the year.

Physical Science: Energy Bar Charts

Students used the textbook to define kinetic and potential energy. I included some questions to try and connect the definitions to yesterday’s observations in the PhET Conservation of Energy sim. On Monday, we’ll have some class discussion so I can see what connections they made. Students will also be doing a few energy bar charts.


 Physics: CTSR
The 11th and 12th grade teachers in my department decided to base our PLC goal on Lawson’s Classroom Test of Scientific Reasoning so that we can focus on integrating more inquiry and critical thinking into our courses. My students are taking it as a pre-test today. Most of the questions are scored in pairs, so students are submitting answers in a Google Form that will automatically calculate scores. Once they finish, students will practice translating between position vs. time graphs, velocity vs. time graphs, and verbal representations by starting the Motion Detector Lab. On Monday, we’ll add in motion maps and get out the detectors.

Day 3: Defining Types of Energy & First Board Meeting

Physical Science: Energy Types

Students used PhET’s Energy Skate Park sim to begin exploring energy. Their directions were to open up the bar graph, then find as many ways as they could to change the size of each bar. Tomorrow, their observations will lead into the definitions for kinetic and potential energy.

Energy skate park screenshot

PhET’s Energy Skate Park

Physics: First Board Meeting

Students prepped whiteboards with their results from the Buggy Lab, then we had our first board meeting. I talked more than I wanted to during the meeting, partly because I was rushing to get students ready for a sub tomorrow and partly because I didn’t take enough time to set expectations or let students pre-discuss in smaller groups. Next time, I want to try using Casey Rutherford’s Observations, Claims, & Evidence structure to provide students with a little more scaffolding. My students were very willing to speak up and take risks during the board meetings, so I’m excited to see how future ones go!

Student whiteboard

Student whiteboard

IMG_0198

Another student whiteboard