Day 37: 3rd Law & Kepler

AP Physics: 3rd Law

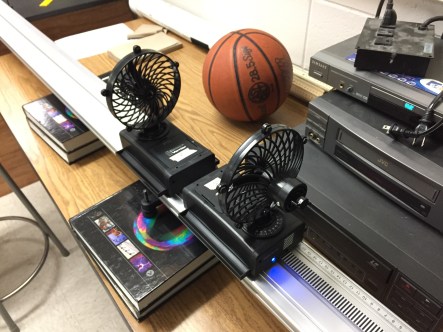
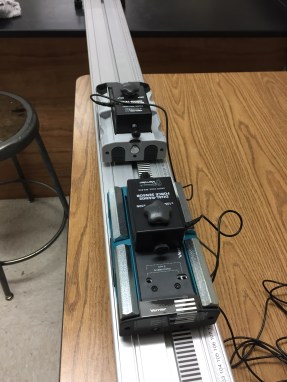
On Friday, students predicted how the force on a pair of carts would compare for various collisions. Today, we got out a pair of carts and force sensors to test out their predictions. I got pretty excited when, after seeing the first couple collisions had the same force, one student took another look at her system schema and free-body diagrams, then pointed out both forces are measuring the same interaction, so the magnitude should be consistent. Afterward, we watched Veritasium’s excellent video on the 3rd Law.
img_2435

Earth Science: Kepler’s Laws

Students drew ellipses and measured the distance between the foci and points on the ellipse to look for patterns. Students were pretty successful at finding the pattern in the distance to the focal points. I tweaked the lab as written to try to have students discover the equal areas law, but I did not account for the fact that the length of the string loops varies a lot. Tomorrow is slated for more time on this lab, so I think I’m going to try and find some data they can use to plot actual positions of one of the planets tomorrow.

img_2433

Day 36: 3rd Law & Cosmic Voyage

Today is day 2 of the NSTA Regional Conference, so students have a sub again.

AP Physics: Newton’s 3rd Law

Students drew free-body diagrams for various cart collisions and predicted how the force on each cart should compare. It usually drives students nuts that I won’t tell them whether they are right in this activity, so I think it will be less frustrating for them to do this with a sub, even if I’ll miss out on hearing them talk it through. On Monday, we’ll put some force sensors on carts and see if the students were right.

Earth Science: Cosmic Voyage

The curriculum calls for showing The Cosmic Voyage during the astronomy unit, so I took advantage of the easy sub plan.

Day 35: TIPERs & Moon Phases

I’m at the NSTA Regional Conference, so students have a sub today.

AP Physics: TIPERs

Students worked through some problems applying Newton’s 2nd Law, mostly out of TIPERs with a few calculations thrown in. I love listening in on the conversations students have on their way to answering TIPERs problems, so I kind of hate leaving it for a sub, but I’m looking forward to seeing their work when I get back.

Earth Science: Moon Phases

Students took their assessment on climate change, then did a follow-up to Tuesday’s lab modeling phases of the moon. Today, they used a moon phase calendar to determine which way the moon revolves around Earth.

moon-phase-calendar

Day 34: Springs & Review

AP Physics: Spring Force

Students looked for a relationship between the force on a spring and the amount it stretches. I rushed the follow-up discussion since I’m going to be out the rest of the week, so I want to make sure to revisit some of the key ideas next week, especially when it comes to interpreting the graphs.

img_2423

Earth Science: Review

I used the same review activity from earlier units where students work with their lab group to write some questions for each learning target, then pass their questions on to another group. Overall, I could tell my students were struggling more to come up with questions than in some of the earlier units. I think a lot of that stems from my own struggles interpreting the learning targets and connecting them to the established lessons. If I’m not clear on what the learning targets mean or how everything connects, my students definitely won’t be.

img_2420

Day 33: Friction & Moon Phases

AP Physics: Friction

Students did a lab to determine which variables impact the magnitude of the force of friction. This lab provided some nice opportunities to talk about uncertainty and how big a difference is big enough to matter. Talking about the uncertainty also lead nicely into the fact that the model of friction on our equation sheet is actually pretty limited.

img_2410

Earth Science: Moon Phases

Students worked through a simple lab using a lamp, softball, and golf ball to model the Moon’s revolution around Earth and predict what phase of the moon would be visible at various positions. Students were very successful at connecting how much of the lit portion of the golf ball was towards the softball to what phase of the Moon would be visible from Earth.

img_2409

Day 32: Dueling Fan Carts & Climate Change

AP Physics: Dueling Fan Carts

I borrowed Frank Noschese’s dueling fan carts activity to reinforce the relationship between net force and motion. We had some good whole-class discussion about using system schema to determine which forces matter. My fan carts don’t produce exactly the same thrust, so there was some acceleration with combinations like high vs. high, but I was pleased at how quickly my students jumped to wanting to find a combination of settings where the forces did balance.

IMG_2404.JPG

Earth Science: Factors in Climate Change

We’ve done a lot of reading graphs and data tables related to climate change, but haven’t really had a chance to synthesize the observations. I used a slide deck that goes one factor at a time and uses actual data to give students the opportunity to determine the impact each factor has on climate. I envisioned this being very discussion heavy, but I was having trouble getting student input and it quickly became more of a lecture, I think in part because I kept students in their desks. I think next time I need to get them at lab tables using whiteboards to get them more actively engaged.

Day 31: Quiz & Human Impacts

AP Physics: Quiz

I missed my AP Physics classes today to chaperone a field trip. they took a quiz on system schema and free-body diagrams, then worked on some 2nd Law problems. It was around this time last year that it finally clicked for me what system schema are for, so this is the first group of students I’ve had that really “get” that representation and truly find it useful. Based on their quizzes, we do need to spend some more time on internal vs. external forces, as well as how to pick your system when the problem doesn’t specify.

Earth Science: Human Impacts on Climate

Students used several different representations of emissions to answer some questions about pollution and its effects. The activity gave students a lot of opportunities to practice reading data tables and graphs, but I found my students did pretty superficial interpretation. My students also made pretty limited connections to the earth science content, and I think finding ways to go deeper on the data interpretation will help with the content connections.

Day 30: Plickers & Ice Core Data

AP Physics: Plickers

I finally graded the first full-length test over the weekend and wanted to go over some of the questions students struggled with. I put the multiple choice questions that students got wrong most often into Plickers and had students vote individually, then discuss with other students, then vote again. There was a lot of great discussion along the way. In my 4th hour, I tried showing them the graph of responses after individual voting. That class came to a correct consensus less often than my 2nd hour where I kept the graph of individual responses hidden, but they also had much deeper conversations. I can’t decide how much of the difference I’d chalk up to the personality of each class and how much I think is a result of running the voting differently; I’ll probably experiment some more next time.

img_2398

Earth Science: Ice Core Data

Students used a graph of temperature changes, CH4 concentration, and CO2 concentration to look for patterns. It was clearly tricky for them to make sense of multiple data sets on the same set of axes, especially since there are three different vertical scales. The first question helped orient them to the horizontal axis, so I think I will add some scaffolding to explicitly focus them on the vertical axes before looking for patterns.

ice-core-graph

Day 29: Board Meeting & Hurricanes

AP Physics: Board Meeting

Students whiteboarded their results from the 2nd Law Lab and we had a board meeting. Students needed a reminder to translate the equation for their lines of best fit into “physics terms”, but they are getting more skilled at that. I was also pleased with how quickly students picked up on things like which groups had similar slopes, which made it easy to build some ideas like why the slopes would change.

img_2389

Earth Science: Hurricane Tracking

Students used some data from 1992’s Hurricane Andrew to plot its path and answer a few questions. They did a nice job connecting what they’ve learned about heat and wind so far to find some patterns in the hurricane’s path and wind speed, but the plotting took a long time. I’m debating whether I want to try and streamline the plotting next year so students can spend more time on the interpretation. It would be very easy to give them a completed map of the hurricane’s path, but I would need to revise or eliminate some of the questions where students paused their plotting to make predictions. Another option would be to put the map into Desmos as an image, then have students type in the coordinates. With the manual plotting, I overheard some conversations where students were connecting coordinates on the map to coordinates on a graph, which is a great connection for them to make and I can’t decide whether Desmos would help or hurt that connection. I also need to identify the key take-aways from this lab to help decide where I want students to spend their time.

Day 28: Modified Atwood’s & Project Wrap-Up

AP Physics: Modified Atwood’s Machine

Students used a modified Atwood’s machine to collect data for a relationship between force and acceleration. We spent some time unpacking that statement since I’ve found it really isn’t obvious to students what that means; last year, a lot of students really struggled to go from that statement to recognizing they needed to change the force and measure acceleration,

img_2383

Earth Science: Wind Turbine Wrap-Up

To conclude the wind turbine project, I gave students some information about an imaginary small farm and tasked them with selecting locations for three wind turbines and preparing a report for our “client” to justify their choice. Unfortunately, with the wind turbines and fans we have, it isn’t practical to set up both the topography and a trio of wind turbines for students to test their plans. Next year, I might try setting up a single, larger test area using a couple of our box fans so that we can have a big enough model for students to actually test their plan.

img_2358