Physical Science: Graphing Challenge
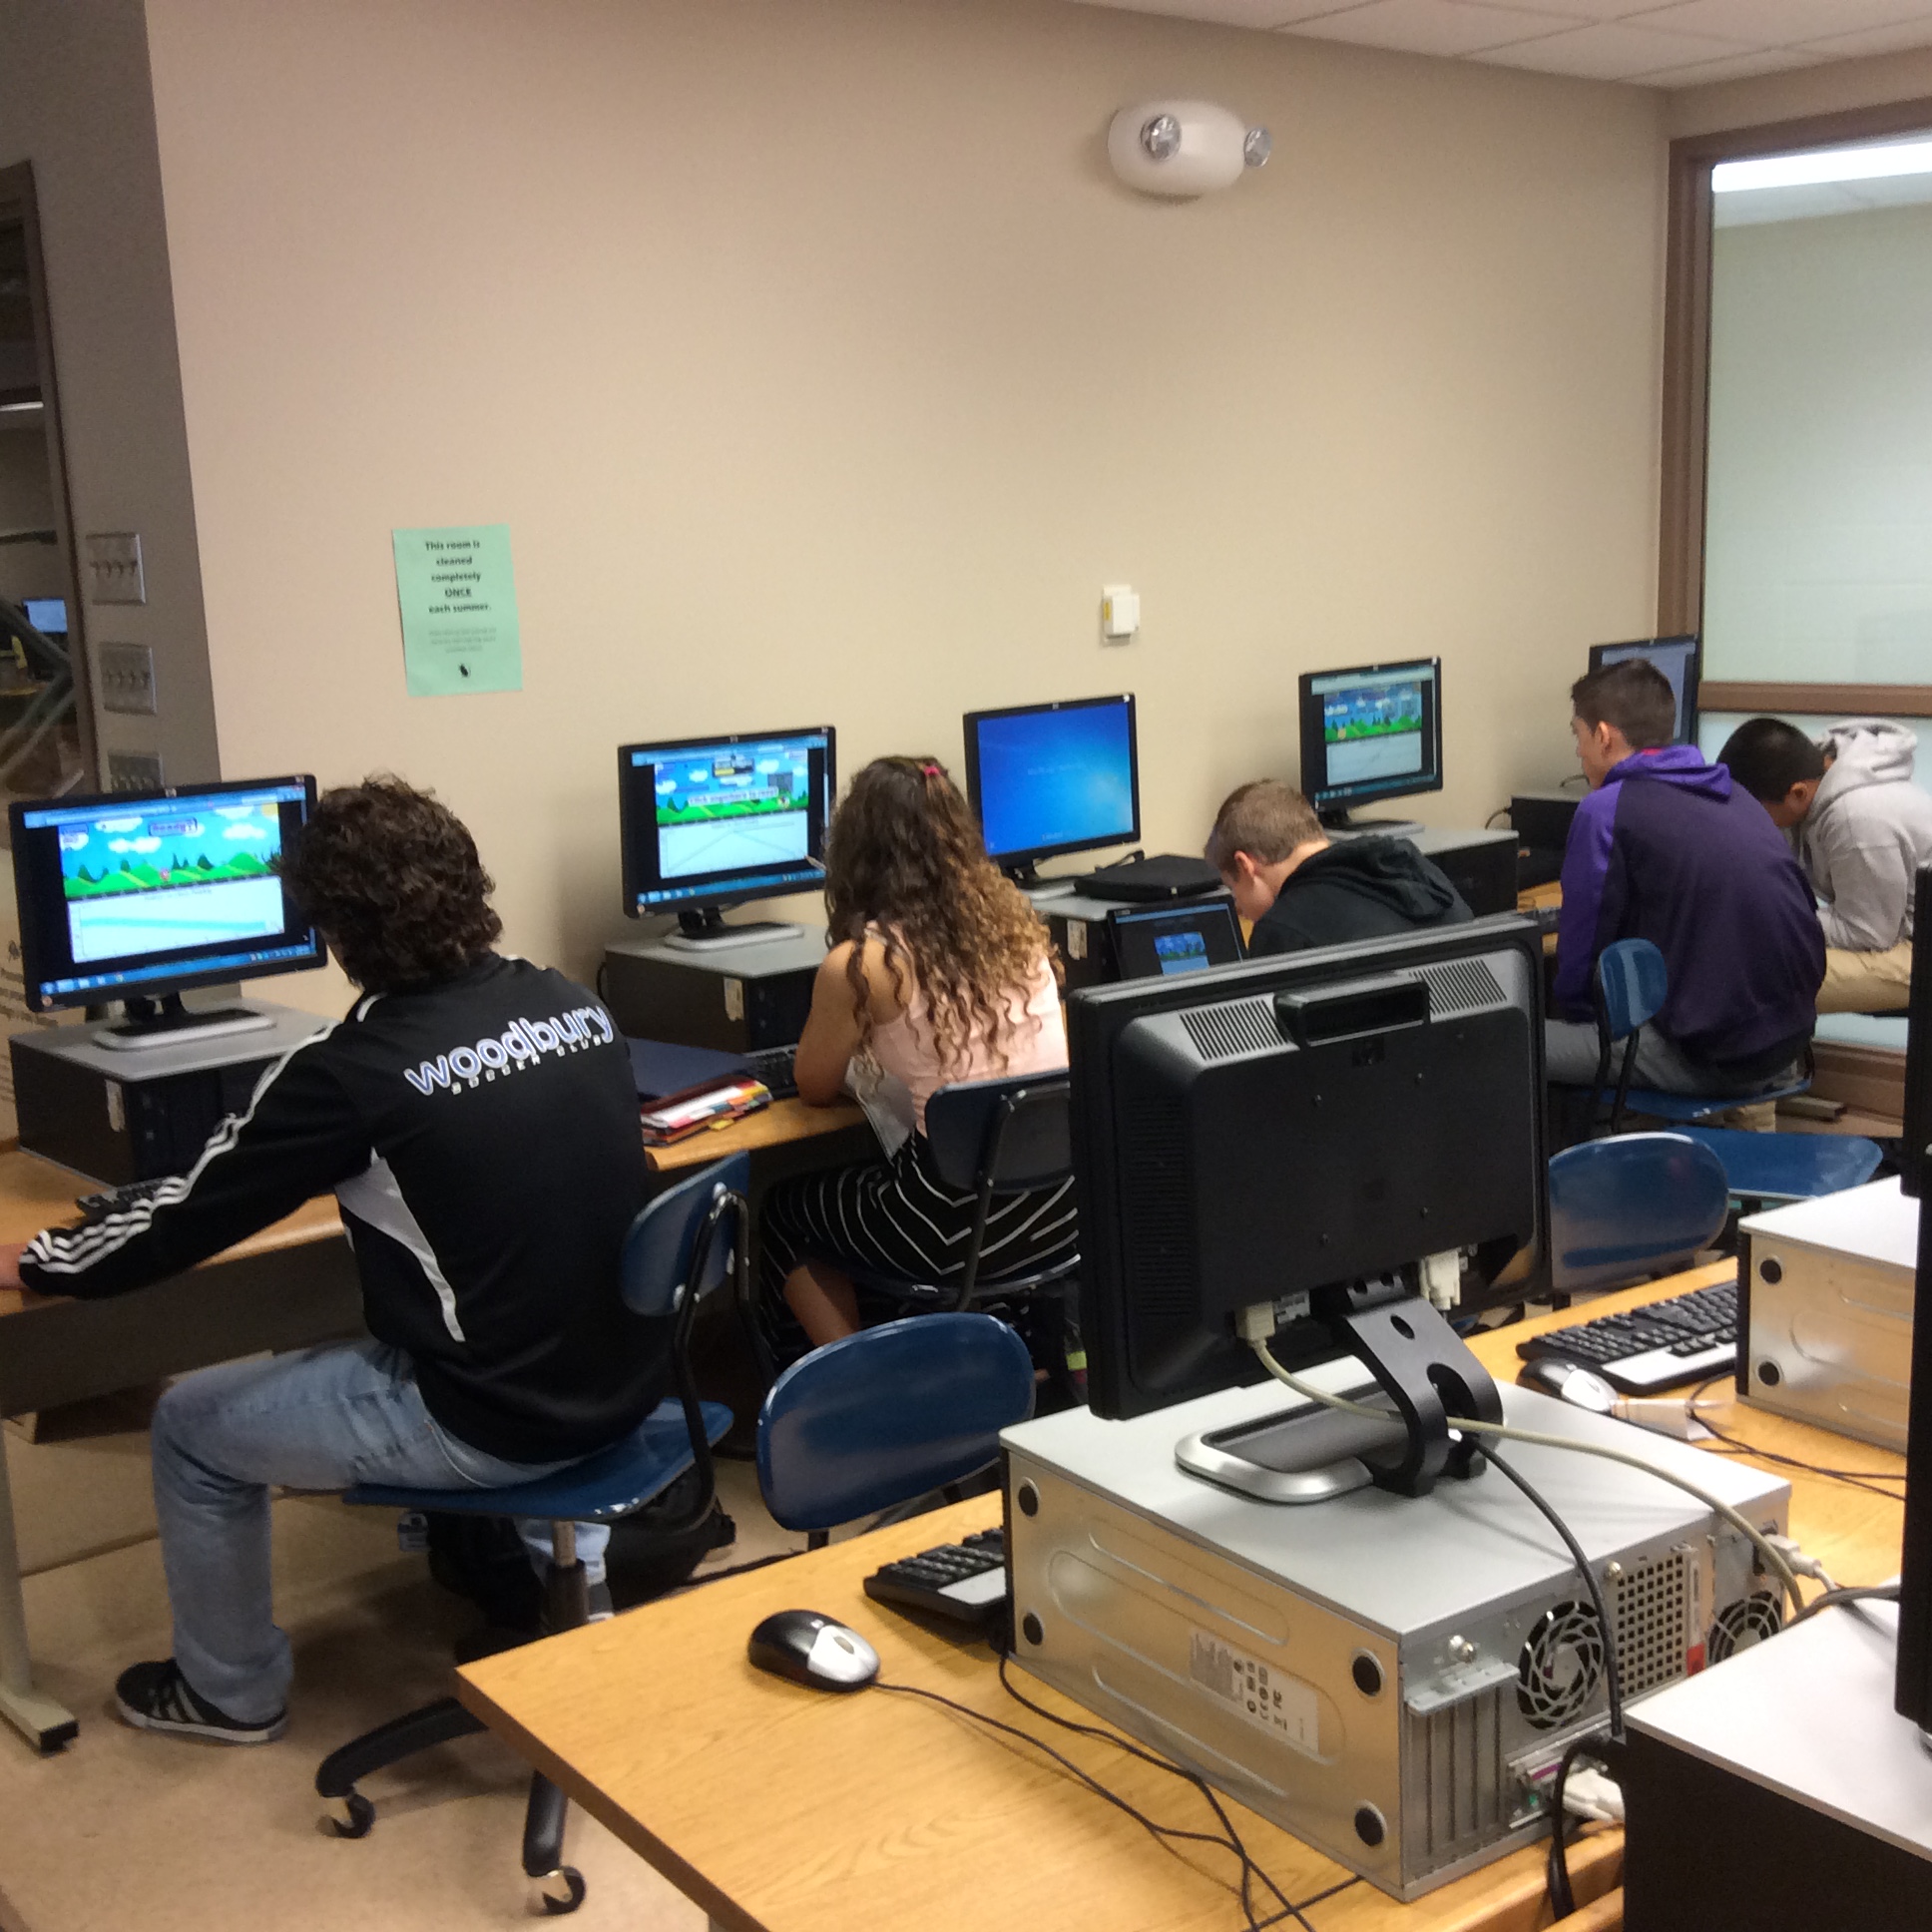
To get a little more practice with position vs. time graphs before we move on to free fall, the class went to the library to play Matt Blackman’s Action Graphing. My strongest students whipped through the early levels and got some exposure to velocity vs. time graphs as well as some calculations on graphs that show acceleration, which I normally don’t go into in this course due to time. Some of my students who need a little more time to master things started out using a lot of guess and check in the game, but were able to calculate correctly and consistently by the end of the period.
Physics: Acceleration Motion Maps
Today, students drew motion maps and sketched graphs for variations on a sphere rolling along a ramp, then we got out the motion detector to check a few of them. I’ve got a number students who took AP Calculus BC last year who were able to work through most of the graphs pretty easily, but some of them retain some important misconceptions. I made sure we spent a lot of time on a cart that rolled up the ramp, then back down, because several students were adamant that a negative acceleration must always mean the object is slowing down. Even for some of the students who talk about velocity and acceleration as derivatives, the graphs for the cart going up and back down were surprising.

