This week was all about velocity vs. time graphs for projectiles. We started with some video analysis of videos students had recorded to see what the graphs looked like. Students did a really nice job during the board meeting of connecting the graphs to other key ideas, like the forces acting on the projectiles. I showed students the three views of a projectile video from Pivot Interactives that shows a side view where the full 2D motion is visible, a top view where only the horizontal motion is visible, and a front view where only the vertical motion is visible. Even though we didn’t do an activity with the videos, students referred back to it when making sense of why we had two different velocity vs. time graphs. It was also fun to see more students making connections to derivatives now that they are further along in calculus than when we did motion in September.
Physics: Cart Explosions
Students did the cart explosion lab from the Modeling Instruction materials. They easily picked up on the pattern in the data, but I never feel like the connection between their data and the idea of conservation of momentum is as clear as I ‘d like. I think one trick is momentum doesn’t have a very good conceptual definition and mathematical reasoning has been challenging so far. Once we started working on momentum bar charts, students were doing really well with them and doing a lot of connecting the bar charts to what they’d observed in the lab, which was great!
This week, students started working on an activity to figure out what interaction causes energy to dissipate as a bouncy ball bounces (I wrote this up for The Science Teacher a few years ago). After observing a bouncy ball, students agreed that some combination of the impact with the table and the air resistance on the bouncy ball are responsible for the energy dissipating, so now their task is to figure out which it is. I spend a lot of time priming students for what evidence might be useful and we started late in the week, so we mostly focused on making one set of energy bar charts for if only the impact dissipates energy and one set for if only the air resistance dissipates energy using five key points along the bouncy ball’s motion (right as it’s released, right as it reaches the table, right as it leaves the table, at the top of the first bounce, and right as it reaches the table a second time). I forgot to get a picture, but one group did a cool thing where they labeled which interaction was happening between each of their bar charts to help keep track of when the dissipated energy should show up. We then had some good discussion about what these energy bar charts tell us we will actually observe in the lab.
Physics: Math Sensemaking
This week felt a little goofy. The other physics teacher and I are doing the same activities on as close the same day as we can so that we can plan together (a key survival tactic when both of us are also doing what are supposed to be full-time jobs outside the classroom!). He is out this week, so we used several Pivot Interactives activities to wrap up forces and introduce momentum (full disclosure: I work for Pivot writing activities). As I worked with students, two big things that aren’t directly tied to the science content ended up at the front of my mind. First, students told me their biggest frustration with the Pivot activities is they had to measure carefully to get the autograded questions correct. I think this fits with where students believe that physics knowledge comes from. When students see experiments, observations, and measurements as where physics knowledge comes from, I find that students tend to measure more carefully because they see a purpose to having good-quality measurements. Combined with some other things I’ve observed about my students, I think many of them see me as the primary source of physics knowledge in the room, so why should it matter whether they measure carefully?
Second, I saw a lot of evidence that students are not attaching physical meaning to their measurements. This was most apparent to me in an activity where students used Newton’s 2nd Law to determine the mass of an unknown object. Students were able to measure the net force on a system that included two gliders and the mystery object as well as make measurements to determine the acceleration of the system. Once they calculated the total mass of the system, a lot of students really struggled with how to use the given mass of the gliders to figure out the mass of the mystery object. This made me think of the work some of my grad school classmates and professors have been doing around blended sensemaking in science (here’s a taste), which is a term for simultaneously doing sensemaking in science and in math. Recognizing they needed to subtract the mass of the two gliders from the total mass required students to recognize what the mass they had calculated represented, how the given mass of the gliders relates to the mass they had calculated, and what the operation of subtraction represents in this context. Doing all of that can be some pretty tricky blended sensemaking! Realizing how much my students are struggling with this is helping me make sense of some of the other struggles I’m seeing in my class right now. I’m not sure what my fix is yet, but I definitely want to keep thinking about how to support students in attaching meaning to numbers and doing blended sensemaking.
This was another week that was a little messy. I had a sub Wednesday through Friday so I could present some of my doctoral research at the ASTE conference. On top of that, we had an ice storm early Wednesday morning that resulted in a late start, so two of my classes didn’t meet
AP Physics 1: Energy
This week was all about applying our model of energy transfer. We had some great discussions before I left where students were navigating how different systems affect the problem. We also did some TIPERs problems where some common preconceptions came out. The last few years, I’ve been working on being more intentional about making sure we discuss what’s correct about those preconceptions and whether there are other questions those ideas are the correct answer to. My students this year have been really receptive to those conversations, which makes for fun discussions and seems to help kids feel comfortable sharing ideas. Once I left, students worked on an energy lab practical in Pivot Interactives and some energy problems from the College Board’s AP Physics 1 workbook. My students were a little nervous about doing those problems without a teacher who knows the content in the room, but I’m betting they will make some good progress with peer conversations.
Physics: Unbalanced Forces
Students started working problems using unbalanced forces. My students and I are getting more comfortable with each other, which is leading to the discussions getting better. That’s helped me make the connection that the reason some of my students have been struggling with the direction of some forces is they don’t have a great conceptual understanding of the interactions involved in some forces, especially the normal force. I made sure we spent some time reinforcing those ideas by doing some things like using the matter model for normal force and a pair of hairbrushes for friction. My go-to move is to place those on a board at different angles to help students get a visual and tactile hook to make sense of what direction the normal and friction forces should go, which seemed to help a lot of students. We also spent some time looking at how the normal force an elevator passenger experiences connects to the acceleration of the elevator. Once I left, they did an unbalanced forces lab practical in Pivot Interactives.
This week we wrapped up conservation of momentum. I’ve been liking doing this before impulse since collisions give us a clear reason to make use of conservation of momentum, but I ended up introducing momentum by just giving students the formula and telling them to calculate it for a bunch of collisions, which worked, but I wasn’t thrilled with. I want to keep thinking about how I could better introduce momentum with this sequence (though in theory I won’t be teaching next year…).
On Monday, I had students work through an activity I’m working on for Pivot Interactives where they switch between thinking in terms of two exploding gliders as a single system and thinking of the gliders as separate systems. I was really pleased with how my students did switching between those two types of thinking after the limited intro to impulse we’ve had. I am wishing we’d spent a bit more time on calculations with momentum before our quiz this week. I usually give students two in-class assessments over every learning target, so I’ll have to make sure we get some more practice before our retake.
This week, students did a lab with ramps to start building the constant acceleration of a particle model. Students used Vernier Video Analysis to get their graphs, and I really love how the video analysis tracks set up motion maps for constant acceleration. Students seemed to feel pretty good about some of the math-y skills in this lab, including linearization and “translating” their line of best fit into a version that has variables that match the experiment and units on the slope and intercept. We then did some mistakes whiteboarding with problems translating between different representations of constant acceleration, which my students continued to do fantastic with.
One thing I think is worth thinking about it it feels like because this is our first experience with linearization, the later days of this lab feel very focused on the math. Then, it feels like we set the heavy math aside while working on translating between representations, only to circle back once we are ready to start doing problems. I wonder if there is a way to structure the constant acceleration unit differently to make it feel more coherent. We have the Vernier motion encoder carts, so I wonder if one option could be to start by having students more or less play with carts on ramps to focus on the shape of graphs, then work on translating representations. Then once students are solid on the representations, do the more standard ramp lab to bring in mathematical representations.
Students used Vernier Video Analysis to get velocity vs. time and position vs. time graphs for a projectile. I saw some students including their throw or after the projectile landed in their video analysis, which makes sense since I’ve seen students struggling more than in the past with recognizing what is the most relevant part of an object’s motion. I think that probably could have been addressed with spending a little more time on some pre-lab discussion. It was a lot of fun to hear their small-group discussions making sense of the graphs once I had them draw a free-body diagram and they recognized why the graphs looked the way they did.
AP Physics 1: Angular Momentum We wrapped up unbalanced torque and rushed through angular momentum. Students started an activity in Pivot Interactives, but were moving through it more slowly than I’d hoped, so I ended up doing a lecture on angular momentum. It’s not my preferred approach, but the clock is ticking for AP exam day! Students seemed to get the concept during the lecture. I did a lot of emphasizing the parallels to linear momentum, which seemed to help. We’ll be doing some problems and whiteboarding next week to wrap up angular momentum, which will be a good opportunity for me to check how clear their understanding is.
We had Friday off this week. I think staff and students alike were very happy to have a long weekend.
Physics: Popper Hoppers
This week we wrapped up energy. After finishing the bouncy ball evidence-based reasoning from last week, we got out the popper hoppers to use energy to find the spring constant of the toy. We haven’t done as much having students decide what measurements to take as I’d like, so students struggled a little at first with what measurements to take. I showed them a strategy from one of my past AP students wo would write out the equation she was going to use to solve for the target variable, then put check marks next to each of the other variables once she had a step in her procedure that would get her a value for that variable. That was exactly what students needed to get a solid plan for the practical.
AP Physics 1: Unbalanced Torque
This week, we worked on unbalanced torque. We used another Pivot Interactives activity (Disclaimer: I work for Pivot Interactives as a content writer. This activity should be published soon!) since I haven’t had a chance to play with the hands-on equipment we purchased for rotation in fall 2019. I’m trying to be pretty conscious of making explicit connections to unbalanced linear forces, both to make sure students aren’t starting from scratch in their understanding and to embed review of earlier topics. Students are seeing those connections pretty clearly, which is great to see.
I also started a countdown to the AP Physics exam on my whiteboard, and noticed students are more focused when working problems. I think the countdown is adding some sense of urgency to what we are working on.
The biggest task this week was a lab to determine the equation for kinetic energy. On some recent labs, students have struggled to get good data. I think part of the issue is many don’t buy into the idea that knowledge should come from the labs they do, so they don’t invest the effort or attention into getting good data, which makes it hard to see how it leads to physics concepts or equations and becomes a self-reinforcing cycle I wanted to interrupt with this lab. We talked a little about what I observed and my hypothesis, then I re-did the gravitational potential energy lab as a demo and made a point of discussing the things I was doing to get good measurements and check the quality of my data as I went. When we were getting ready to whiteboard, I also checked in with groups to make sure they had quantities on the correct axis and were seeing that they needed to linearize. The result was data that really nicely showed the quadratic relationship between kinetic energy and velocity and most graphs even had slopes very close to half the mass of the carts students used! A lot of students were really proud of their results, which was great to see and I’m hoping will encourage them to continue those good data collection practices.
AP Physics 1: Centripetal Force
I like to ignore the College Board’s recommendation to do centripetal force as unit 3 because it is such a nice opportunity for built-in review of a lot of ideas about forces. We started by spinning some rubber stoppers on strings to talk qualitatively about how we could change the force in the string before moving over to Pivot Interactives to collect quantitative data (disclaimer: I am a content writer for Pivot Interactives). Next, we used an activity I originally got from Lucas Walker using exoplanet data to find the law of universal gravitation. Students are making the connections I want them to, but I can tell they are starting to feel some fatigue. I typically rely a lot on Pivot Interactives for this topic since we don’t have much equipment, but students got pretty into the brief hands-on activities we did this week, so I think I should make sure to keep working those in to help my students stay engaged these next few weeks.
Students did a lab to introduce energy where they pulled carts up ramps at different angles, always raising the cart to the same height above the table, then measured the average force they needed and the distance they had to pull the cart for each angle. Then, they sketch force vs. distance graphs and see they always have the same area. The data was rough enough this year that students could see that a steeper angle required a larger force and a smaller distance, but the areas varied a lot. We’ve had a few labs lately where the data came out pretty rocky. I think part of what’s going on is it’s been tough this year in general for students to see connections between what happens in the lab and the physics concepts we are learning. If the labs are something disconnected from the rest of your learning, why would you invest time and attention into collecting high-quality data? We’re also at the end of a trimester when more students than usual are scrambling to raise their grades after an unusually challenging term and the February doldrums have been hitting everyone harder than usual, so students have less attention and mental energy to go around than usual. Aside from the final, we won’t have any more labs until tri 3, which is a good time for a fresh start. In the meantime, the other physics teacher and I need to do some thinking about how we will continue to draw connections between labs and physics concepts and make sure students have what they need to get good-quality data.
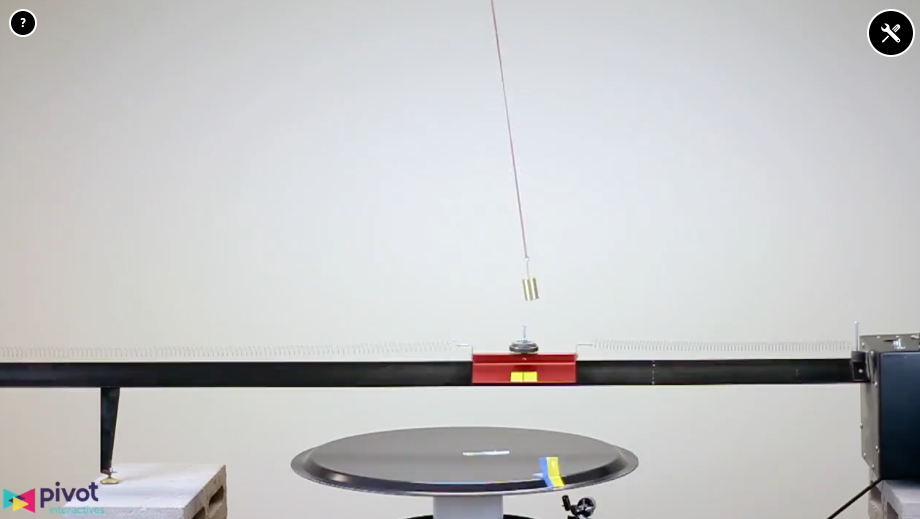
AP Physics 1: Pendulums
This week, we started working on simple harmonic motion. For the first activity, students used a video from Pivot Interactives that shows a pendulum, a cart attached to springs, and a spinning disk all in synchronized simple harmonic motion. Students made position vs. time graphs for each object, which always works well for some discussion not only of how the motion of all three is similar, but to establish some important ideas like the non-constant force and the repeating patterns in the motion of each object. After that, we dove into a deeper focus on pendulums by doing a lab to find the factors that affect the period of a pendulum. This model is going to be split over spring break, which got me thinking about how I currently have the unit structured. Right now, I have one standard for pendulums and one standard for springs. But, especially since I start by emphasizing how similar those two kinds of motion are, I wonder if it would make sense to instead have a standard about using multiple representations like motion graphs and energy bar charts to describe simple harmonic motion that includes both springs and pendulums, then a separate standard on the mathematical relationships and factors that affect the period which also applies to both pendulums and springs. That seems like it would better represent the different kinds of thinking I ask students to do over the course of the unit.
This week, we wrapped up the cart explosion lab and started working on momentum bar charts. My students had really good results on the cart explosion lab, but connecting it to momentum in the discussion is always rough. Students launch a spring-loaded cart and a standard cart off each other, figuring out where on a track to start them so they reach the ends at the same time, then record the ratio of the cart’s masses and the ratio of the distances they travelled before changing the mass and trying again. While I love that this low-tech approach incentivizes students to look for a pattern while they are collecting data, students struggle to connect the distances travelled to the velocities, I think mostly because there are so many different numbers flying around. During the discussion, my students had great results, but needed a lot of support to connect them to momentum. I want to rethink our momentum unit anyway, and I think part of that will include clarifying what I want students to get out of this lab and whether there are better ways to achieve that purpose.
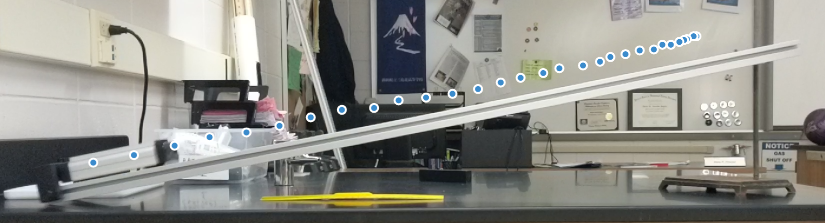
AP Physics 1: Projectile Graphs
We started the week with a Pivot Interactives activity that shows three views of a projectile (full disclosure: I am an activity writer for Pivot Interactives). I’ve done video analysis, but I really like the way seeing the motion from different angles solidifies what I mean by the horizontal and vertical motion. It’s been a while since we did much with velocity vs. time graphs and students made solid connections to the forces acting on the projectile. We also worked through an activity I got from Michael Lerner where students describe the motion of an orange falling from a tower using every model we’ve learned so far, which really helped reinforce for students are aren’t really doing something new, just applying what we know to a new context.