AP Physics 1: Projectile Graphs
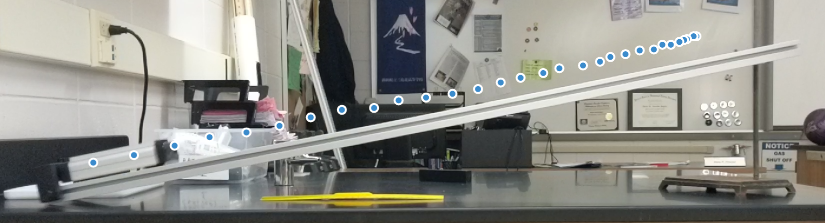
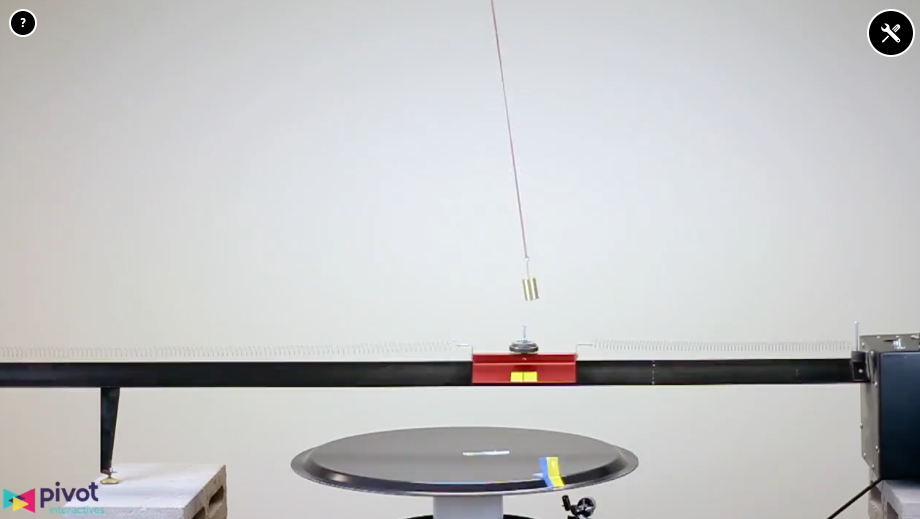
This week was all about velocity vs. time graphs for projectiles. We started with some video analysis of videos students had recorded to see what the graphs looked like. Students did a really nice job during the board meeting of connecting the graphs to other key ideas, like the forces acting on the projectiles. I showed students the three views of a projectile video from Pivot Interactives that shows a side view where the full 2D motion is visible, a top view where only the horizontal motion is visible, and a front view where only the vertical motion is visible. Even though we didn’t do an activity with the videos, students referred back to it when making sense of why we had two different velocity vs. time graphs. It was also fun to see more students making connections to derivatives now that they are further along in calculus than when we did motion in September.
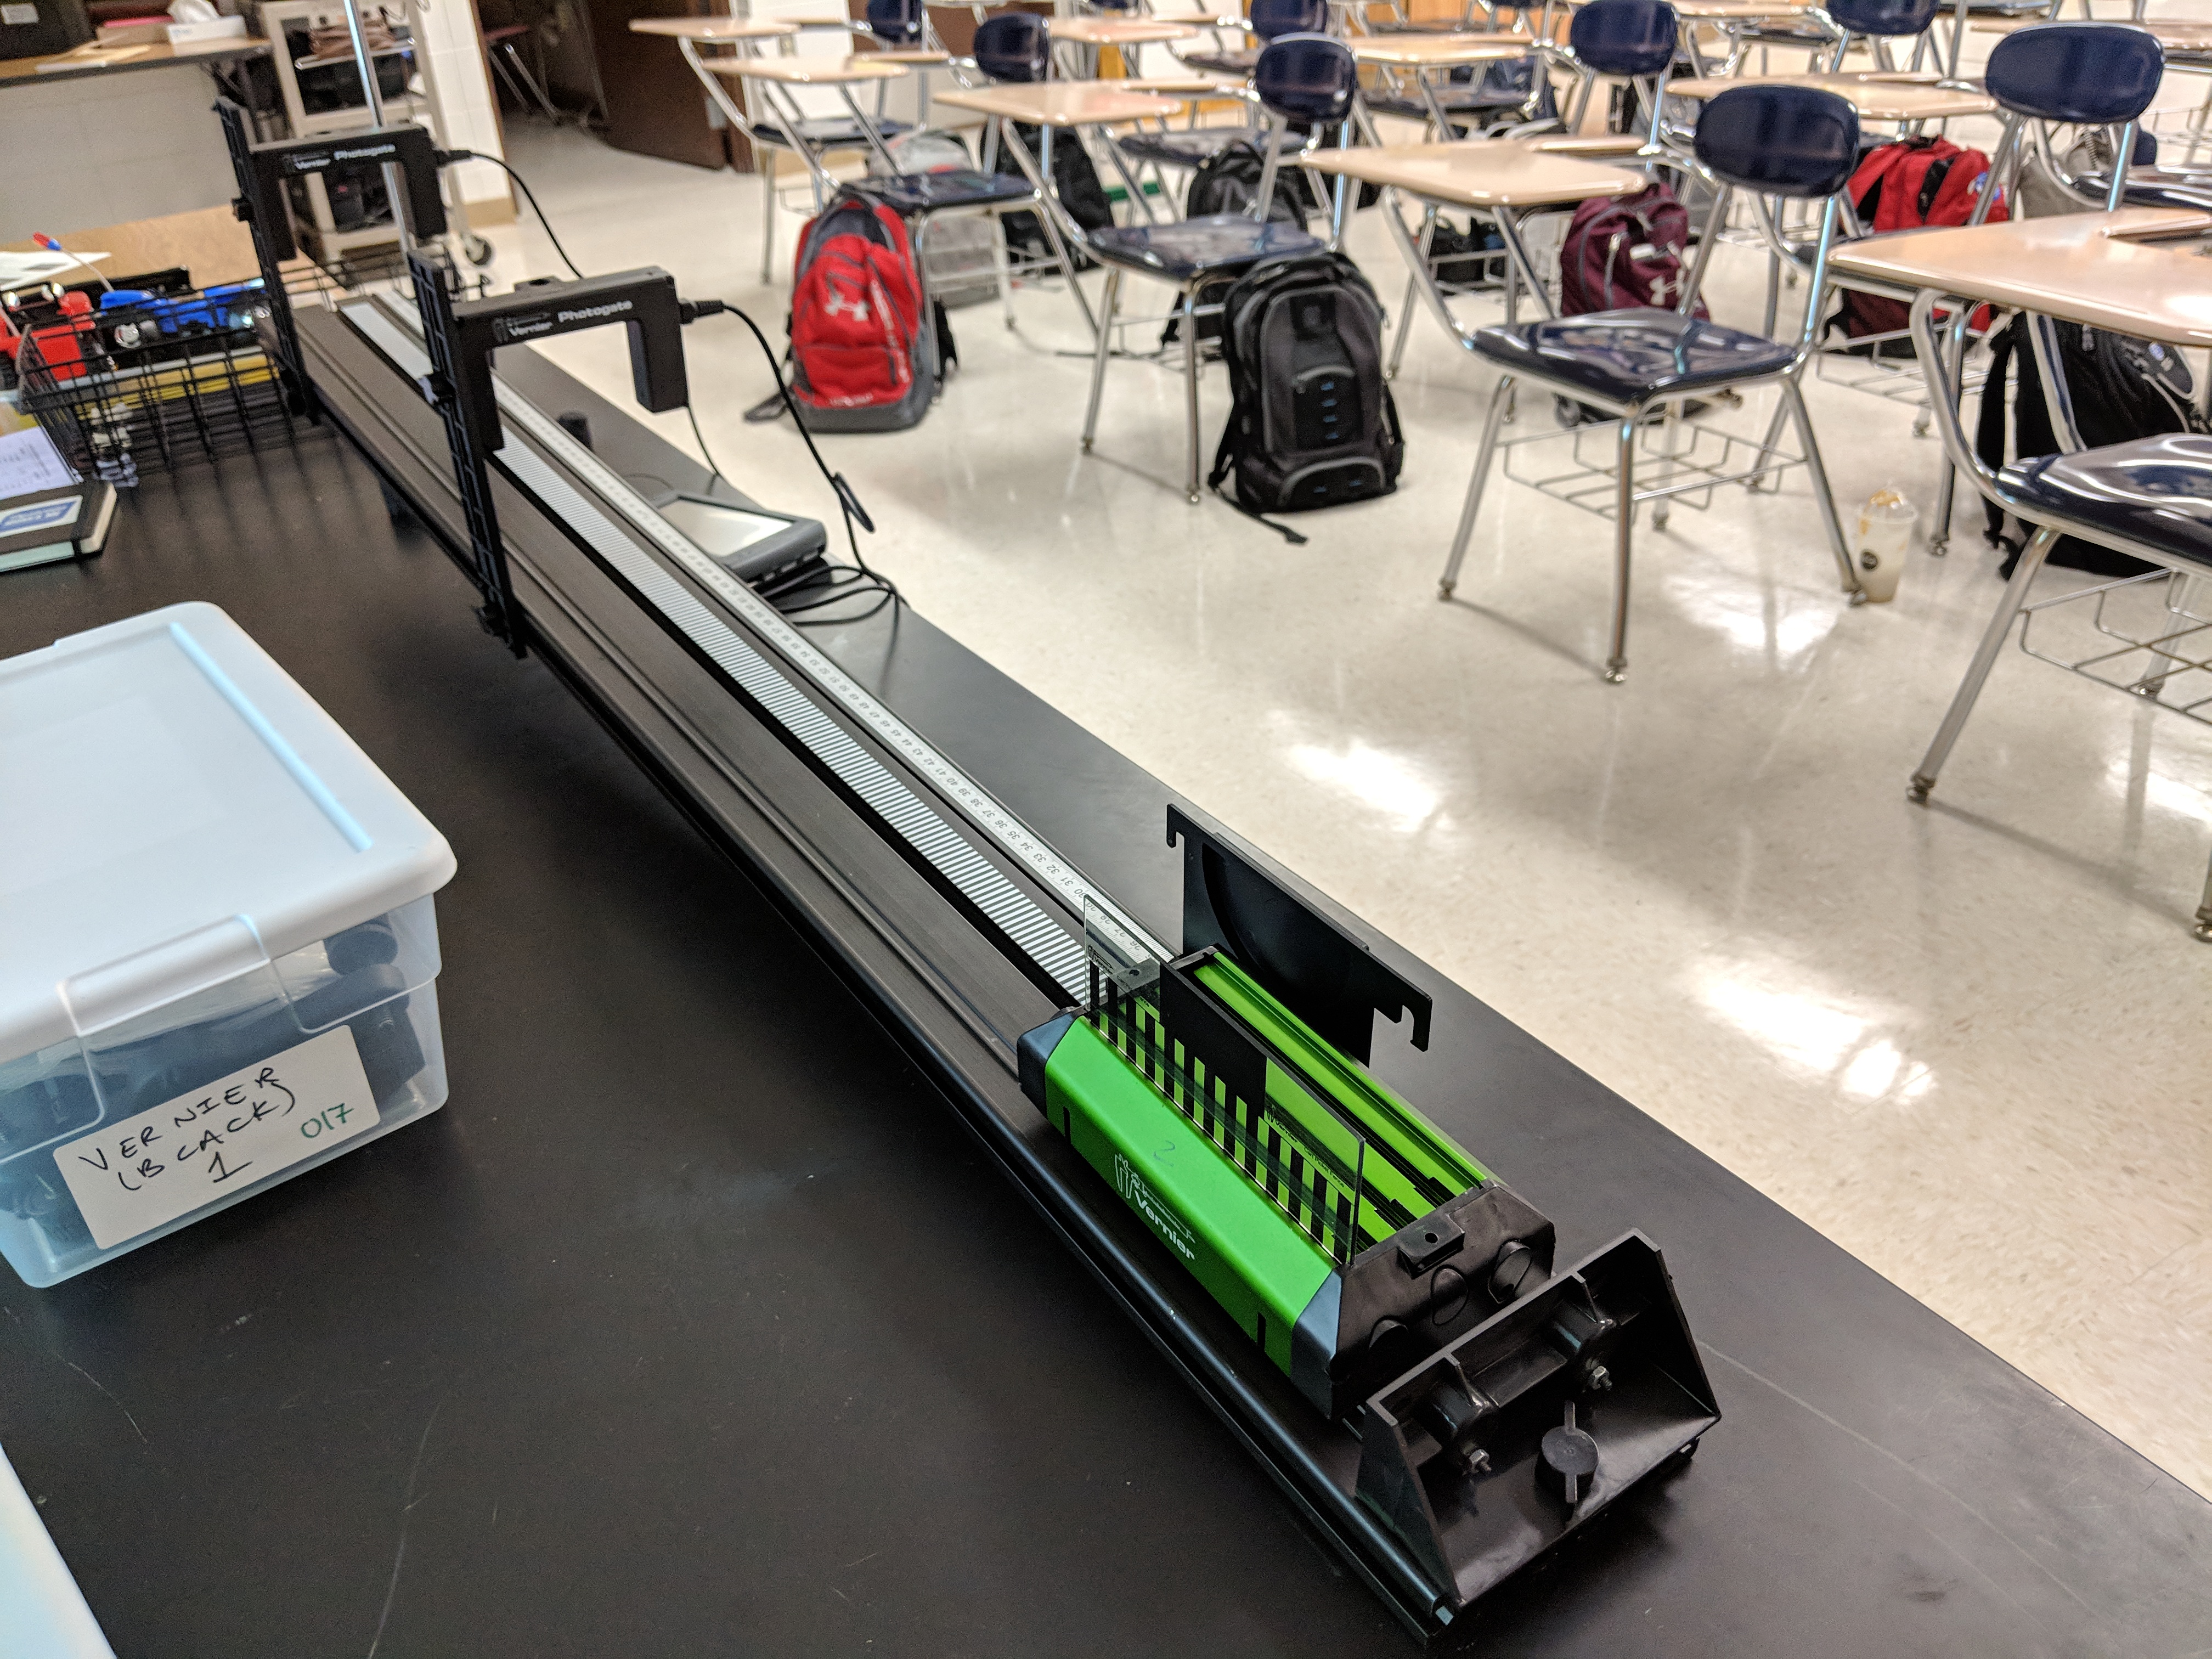
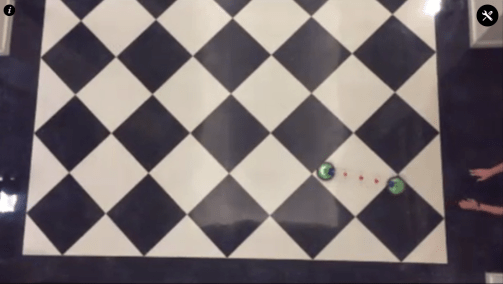
Physics: Cart Explosions
Students did the cart explosion lab from the Modeling Instruction materials. They easily picked up on the pattern in the data, but I never feel like the connection between their data and the idea of conservation of momentum is as clear as I ‘d like. I think one trick is momentum doesn’t have a very good conceptual definition and mathematical reasoning has been challenging so far. Once we started working on momentum bar charts, students were doing really well with them and doing a lot of connecting the bar charts to what they’d observed in the lab, which was great!