Day 38: Pushing Blocks & Kepler’s 2nd Law

AP Physics: Pushing Blocks

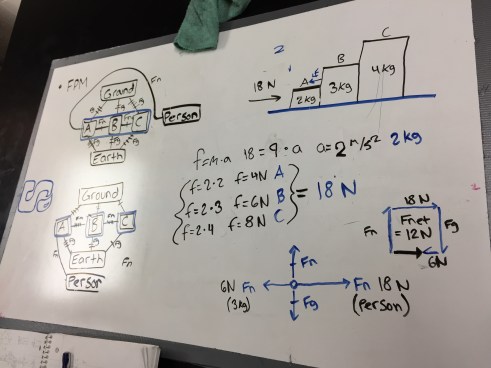
Students worked on a problem I’ve come to really like where three blocks of different masses are being pushed along by a certain force. Based on some of the struggles a few groups were having, I think it would be worthwhile to pause sometime soon to do a model summary. I loved the moment when students figured out how to use the 3rd Law to think about the normal forces between each pair of blocks. The best thing I overheard, though, was a student who said “You need to convince me you’re right! If you can explain your idea and your evidence, then I’ll believe you.”

img_2438

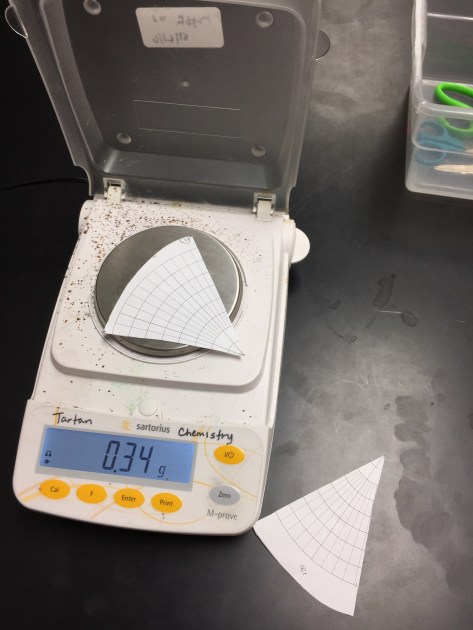
Earth Science: Kepler’s 2nd Law

Students plotted the position of Mars along its orbit, then cut out some wedges that represent the same amount of time. We used the mass as a stand-in for area to show that an orbiting object sweeps out the same area in the same amount of time. We got really nice results; the class average for the mass was within 0.01 g for the two wedges. I think students lost track of what they were plotting, however, so I need to think about how I can reinforce what the numbers they are plotting has to do with the actual path of Mars.

img_2436

Day 37: 3rd Law & Kepler

AP Physics: 3rd Law

On Friday, students predicted how the force on a pair of carts would compare for various collisions. Today, we got out a pair of carts and force sensors to test out their predictions. I got pretty excited when, after seeing the first couple collisions had the same force, one student took another look at her system schema and free-body diagrams, then pointed out both forces are measuring the same interaction, so the magnitude should be consistent. Afterward, we watched Veritasium’s excellent video on the 3rd Law.
img_2435

Earth Science: Kepler’s Laws

Students drew ellipses and measured the distance between the foci and points on the ellipse to look for patterns. Students were pretty successful at finding the pattern in the distance to the focal points. I tweaked the lab as written to try to have students discover the equal areas law, but I did not account for the fact that the length of the string loops varies a lot. Tomorrow is slated for more time on this lab, so I think I’m going to try and find some data they can use to plot actual positions of one of the planets tomorrow.

img_2433

Day 36: 3rd Law & Cosmic Voyage

Today is day 2 of the NSTA Regional Conference, so students have a sub again.

AP Physics: Newton’s 3rd Law

Students drew free-body diagrams for various cart collisions and predicted how the force on each cart should compare. It usually drives students nuts that I won’t tell them whether they are right in this activity, so I think it will be less frustrating for them to do this with a sub, even if I’ll miss out on hearing them talk it through. On Monday, we’ll put some force sensors on carts and see if the students were right.

Earth Science: Cosmic Voyage

The curriculum calls for showing The Cosmic Voyage during the astronomy unit, so I took advantage of the easy sub plan.

Day 35: TIPERs & Moon Phases

I’m at the NSTA Regional Conference, so students have a sub today.

AP Physics: TIPERs

Students worked through some problems applying Newton’s 2nd Law, mostly out of TIPERs with a few calculations thrown in. I love listening in on the conversations students have on their way to answering TIPERs problems, so I kind of hate leaving it for a sub, but I’m looking forward to seeing their work when I get back.

Earth Science: Moon Phases

Students took their assessment on climate change, then did a follow-up to Tuesday’s lab modeling phases of the moon. Today, they used a moon phase calendar to determine which way the moon revolves around Earth.

moon-phase-calendar

Day 34: Springs & Review

AP Physics: Spring Force

Students looked for a relationship between the force on a spring and the amount it stretches. I rushed the follow-up discussion since I’m going to be out the rest of the week, so I want to make sure to revisit some of the key ideas next week, especially when it comes to interpreting the graphs.

img_2423

Earth Science: Review

I used the same review activity from earlier units where students work with their lab group to write some questions for each learning target, then pass their questions on to another group. Overall, I could tell my students were struggling more to come up with questions than in some of the earlier units. I think a lot of that stems from my own struggles interpreting the learning targets and connecting them to the established lessons. If I’m not clear on what the learning targets mean or how everything connects, my students definitely won’t be.

img_2420

Day 33: Friction & Moon Phases

AP Physics: Friction

Students did a lab to determine which variables impact the magnitude of the force of friction. This lab provided some nice opportunities to talk about uncertainty and how big a difference is big enough to matter. Talking about the uncertainty also lead nicely into the fact that the model of friction on our equation sheet is actually pretty limited.

img_2410

Earth Science: Moon Phases

Students worked through a simple lab using a lamp, softball, and golf ball to model the Moon’s revolution around Earth and predict what phase of the moon would be visible at various positions. Students were very successful at connecting how much of the lit portion of the golf ball was towards the softball to what phase of the Moon would be visible from Earth.

img_2409

Day 32: Dueling Fan Carts & Climate Change

AP Physics: Dueling Fan Carts

I borrowed Frank Noschese’s dueling fan carts activity to reinforce the relationship between net force and motion. We had some good whole-class discussion about using system schema to determine which forces matter. My fan carts don’t produce exactly the same thrust, so there was some acceleration with combinations like high vs. high, but I was pleased at how quickly my students jumped to wanting to find a combination of settings where the forces did balance.

IMG_2404.JPG

Earth Science: Factors in Climate Change

We’ve done a lot of reading graphs and data tables related to climate change, but haven’t really had a chance to synthesize the observations. I used a slide deck that goes one factor at a time and uses actual data to give students the opportunity to determine the impact each factor has on climate. I envisioned this being very discussion heavy, but I was having trouble getting student input and it quickly became more of a lecture, I think in part because I kept students in their desks. I think next time I need to get them at lab tables using whiteboards to get them more actively engaged.

Day 29: Board Meeting & Hurricanes

AP Physics: Board Meeting

Students whiteboarded their results from the 2nd Law Lab and we had a board meeting. Students needed a reminder to translate the equation for their lines of best fit into “physics terms”, but they are getting more skilled at that. I was also pleased with how quickly students picked up on things like which groups had similar slopes, which made it easy to build some ideas like why the slopes would change.

img_2389

Earth Science: Hurricane Tracking

Students used some data from 1992’s Hurricane Andrew to plot its path and answer a few questions. They did a nice job connecting what they’ve learned about heat and wind so far to find some patterns in the hurricane’s path and wind speed, but the plotting took a long time. I’m debating whether I want to try and streamline the plotting next year so students can spend more time on the interpretation. It would be very easy to give them a completed map of the hurricane’s path, but I would need to revise or eliminate some of the questions where students paused their plotting to make predictions. Another option would be to put the map into Desmos as an image, then have students type in the coordinates. With the manual plotting, I overheard some conversations where students were connecting coordinates on the map to coordinates on a graph, which is a great connection for them to make and I can’t decide whether Desmos would help or hurt that connection. I also need to identify the key take-aways from this lab to help decide where I want students to spend their time.

Day 28: Modified Atwood’s & Project Wrap-Up

AP Physics: Modified Atwood’s Machine

Students used a modified Atwood’s machine to collect data for a relationship between force and acceleration. We spent some time unpacking that statement since I’ve found it really isn’t obvious to students what that means; last year, a lot of students really struggled to go from that statement to recognizing they needed to change the force and measure acceleration,

img_2383

Earth Science: Wind Turbine Wrap-Up

To conclude the wind turbine project, I gave students some information about an imaginary small farm and tasked them with selecting locations for three wind turbines and preparing a report for our “client” to justify their choice. Unfortunately, with the wind turbines and fans we have, it isn’t practical to set up both the topography and a trio of wind turbines for students to test their plans. Next year, I might try setting up a single, larger test area using a couple of our box fans so that we can have a big enough model for students to actually test their plan.

img_2358


Day 27: Elevators & Turbine Interference

AP Physics: Elevators

I showed students a video I made riding the elevator with a balance and asked them to determine whether the elevator was going up or going down and support their answer with free-body diagrams. I was pleased with how many groups started their conversation with “What’s our system?” I could tell from the conversations that a lot of students are still not entirely solid on the idea that an acceleration can be in the opposite direction of the motion, but thinking about the bowling ball lab from a few days ago seems to be helping. Next year, I want to do a better job of using the change in velocity arrows that show up in Etkina to help solidify the direction of acceleration.


Earth Science: Turbine Interference

In the next step towards designing a wind farm, students experimented with several turbines, comparing the amperage produced with different arrangements. This lab got my students asking some great questions that had me wishing that the trimester on physics came first rather than second this year. A lot wanted to know why the last turbine in a line wasn’t spinning, which is easy to explain with conservation of energy. A few others wanted to know what’s inside the turbine, which fits great with the build-a-motor lab we do in 9th grade physics. When we work on next year’s schedule, I’ll make sure to advocate for physics-earth-earth rather than this year’s earth-physics-earth sequence.

img_2336