Day 95: More Energy & Sledding Problem

AP Physics: More Energy

I split the class in half with some groups doing a lab for elastic energy and others doing a lab for kinetic energy. The groups looking at elastic energy looked for a relationship between how much a spring launcher is compressed and the maximum height above the table the launched cart reaches. The groups doing kinetic energy looked for a relationship between the starting height of a cart above the table and the speed at the bottom of the track.

phys lab.jpg

Physical Science: Sledding Problem

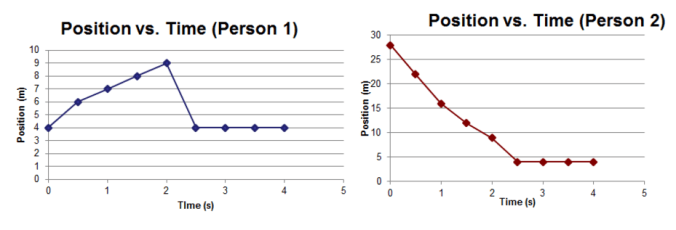
I gave students two position vs. time graphs that I said describe two people sledding, and had them do some interpretation. Students started by describing the motion of each sledder, then identifying where they collided. Finally, each group prepared a CER for who’s fault the collision is, which we then used for a short philosophical chairs where students made their case to the rest of the class. This lead nicely into a brief discussion of assumptions and they role they play in generating an explanation or a claim in science.

The sledding story made the coordinate system tricky for students. I wish I’d spent time discussing the descriptions of the motion so we could make sense of them moving in opposite directions.

sledding-graphs

Day 94: Intro to Energy & Motion Graphs

AP Physics: Intro to Energy

Students picked a height to raise their cart above the table, then made a rough force vs. displacement graph and repeated for additional angles. We compared the areas of the graphs, then defined that area as the change in gravitational potential energy. The biggest hangup is that students are so used to graphing their data that I have trouble getting across that I want a description of an individual run, instead. I might try some additional discussion prior to the lab next time.

As a side note, it was interesting to watch what looked like some gender dynamics in one of my classes. All but one of my all-male groups picked a fairly high point to raise their carts to, then used very steep angles, getting their tracks nearly vertical. The one all-female group in the class picked the lowest point they could, then did very shallow angles. I also had one mixed-gender group, and they picked both a height and angles right in the middle.


Physical Science: Motion Graphs

We finished whiteboarding results from the video analysis, following each up with a similar case on the motion detector. I should have broken up the discussion a bit more, which reinforces what I was already thinking about with going low-tech for constant velocity, then introducing video for constant acceleration. I also had students move away from their lab tables for the group discussion, and talked a bit about why I was doing it, and students were much more focused on the whole-class discussion this time.

Day 86: Collisions & Presentations

AP Physics: Collisions

Today, we started expanding the momentum transfer model to cases where two objects are moving before the collision. We got out the photogates so students could find the velocity before and after various collisions of two carts. I got a kick out of how exciting it was for some students to use .

collisions.jpg

Physical Science: Presentations

Students presented their research projects on different energy sources. I like the sort-of-public forum to share their work, but it is tough for students to sit through a bunch of presentations, even though I never spend more than half the class period on them. For next year, I want to put some thought into other formats that might balance the public accountability with more active engagement. Maybe a poster session with some kind of task for students as they view each others’ work.

Day 77: Friction on Ramps & Energy Sources

AP Physics: Friction on Ramps

Students whiteboarded a few of the questions from yesterday’s activity examining motion graphs for a cart on a ramp. Usually, most of my students rotate their vector addition diagrams so that the legs of any right triangles are parallel to the edges of their paper. Today, I didn’t see any rotated diagrams; I don’t think its a coincidence that today was also the first time I saw students consistently make very strong connections to the physical situation they describe. Now I’ve got a chicken and egg question; did students leave the orientation of their diagrams because they saw the physical meaning, or did they see the physical meaning because they left the orientation?

I also had students write a CER on whether friction is negligible in the data I gave them. I ended up really liking how small the accelerations are; the acceleration when the cart is moving upward is only about 0.05 m/s/s larger than the acceleration when the cart is moving downward, but it works out to a 25% difference, so students had some great conversation about uncertainty and how big a difference is big enough to matter.


Physical Science: Energy Sources

Students signed up for a topic and started researching different energy sources for a short presentation. Minnesota has a standard about comparing and contrasting different energy sources, so I have them research the pros and cons of their energy source. I need to think about what I want to have students do when the are watching presentations at the end of the project.

Next year, I might introduce this project at the start of the electricity unit. I like connecting the energy sources to what students know about electromagnetism, but I think I can maintain that connection if I make the project due after the unit has ended. I always have at least some students without internet access at home, so I try to provide some in-class worktime for the project. Since I do several simulation labs during the electricity unit, I could build in some worktime by encouraging students who finish the lab early to work on their research.

Day 72: Vector Addition & Electric Power

AP Physics: Vector Addition

I shamelessly stole an activity that Casey Rutherford shared on Twitter. I gave students some free-body diagrams drawn to scale, and had them use pipe cleaners to rearrange the vectors and do some graphical vector addition. The activity not only reinforced graphical vector addition, but I was pleased with how it drove home the difference between forces that are balanced and forces that are equal.

vectors

Physical Science: Electric Power

Students plugged different light bulbs into Kill-A-Watt monitors to find the power each one used. To emphasize the connection to energy, I also had students sketch energy bar charts for each light bulb, using light and thermal energy as their energy types. This lead very nicely into a comparison of the efficiency of different light bulb types.

killawatt

Day 66: Projectile Practical & Seismic Accelerator

AP Physics: Projectile Practical

Students wrapped up a lab practical today, predicting where a horizontally launched marble will hit the floor. Once they pulled it off, I pulled out a lighter marble and asked them to predict where it would hit without taking any new measurements. Last year, most groups spent a fair bit of time debating what should happen and trying lots of different calculations before they figured it out. This year, as soon as I pulled out the lighter marble, every group confidently stated it should hit the same spot and gave beautiful explanations for why. Its clear I’ve done a better job this year of giving students opportunities to confront that misconception.

carbon-paper

The retired referral forms work well as carbon paper

Physical Science: Seismic Accelerator

I showed students the seismic accelerator and asked them to predict what would happen when I dropped it, presenting their answer as a CER. Groups consistently drew nice bar charts, but, since we haven’t done anything quantitative with energy, it was tough for many students to recognize the tiny bouncy ball should fly above the original height. I like this as a follow-up to the bouncy ball lab, but next year, instead of having them make predictions, it might work better to show them what the seismic accelerator does, then have them draw bar charts and explain why the red ball goes so high.

Day 65: Writing Methods & Bouncy Ball Energy

AP Physics: Writing Methods

Today, students started working on a lab practical to predict where a marble will hit the floor when it rolls off the edge of a table. Since my PLC is focusing on experimental design this year, I had each group write a method they could use to consistently release the marble and find its horizontal velocity. Then, I collected a method from each group, shuffled them, and gave each group a method they had to try and follow. In my second section, I told students they should actually find the horizontal velocity, then write the method in a way that the next group should get the same result, which really seemed to help students decide how much detail to include. This also very naturally lead to a lot of groups talking about how big their uncertainty is so they could decide if the group using their method was “close enough.”img_20161214_120111

Physical Science: Bouncy Ball Energy

Students measured the rebound heights as various bouncy balls bounced to look at the energy lost. While students really like the lab (bouncy balls are fun!), they don’t have to do much thinking about energy, even though I added some bar charts and energy questions. Tomorrow, I might pull out the seismic accelerator to have them make some predictions about a stack of bouncy balls in order to get them thinking about energy in these systems a little more.

img_20161214_084217

Day 64: Mistakes Game & Bar Charts

AP Physics: Mistakes Game

We whiteboarded yesterday’s problems using the Mistakes Game. Most groups came up with their mistake by either talking about what they thought the most common wrong answer would be or by picking a mistake they made on the way to solving the problem. The highest math class had a field trip today, so a fair number of students were missing, but some students who are normally very quiet stepped up and spoke quite a bit, so I didn’t have to say much during either discussion. I was also pretty happy when the group presenting pointed to the “momentum force” on their free-body diagram and another student quoted Inigo Montoya from The Princess Bride.

IMG_20161213_093130.jpg

Physical Science: Bar Charts

Students worked on drawing energy bar charts. Some students are struggling with how to tell which types of energy are present, but most got the hang of it once they revisited the definitions of the different types of energy. I do want to keep thinking about how I introduce energy in that class

Day 63: Projectile Problems & Energy Conservation

AP Physics: Projectile Problems

For most of the hour, students worked on some problems for projectiles launched horizontally. A few students needed reminders to start by sketching and annotating their velocity-time graphs, but students were pretty successful once they remembered to use the graphs. Students also checked to make sure I’m not going to do anything crazy tomorrow, like go over the problems, when they’ve much rather do the Mistake Game.

On Friday, students requested slow-motion video of the race between a horizontally launched marble and a marble in free-fall, so I recorded some video before school.


Earth Science: Energy Conservation

Students whiteboarded their predictions for the scenarios in PhET’s Energy Skate Park I’d given them Friday, then we tested predictions and discussed the results. We especially focused on the total energy bar to get the idea of conservation of energy.

img_20161212_082543

Day 62: Board Meeting & Energy Types

AP Physics: Board Meeting

Today, students whiteboarded the results of yesterday’s video analysis. Since my 2nd hour had quite a bit of discussion and worked through much of the sense-making while they were in the computer lab yesterday, I skipped some of the structure I’ve been using in board meetings and we got to the big ideas pretty quickly, which left time to whiteboard CERs of predictions for a demo that drops one marble straight down while launching a second horizontally. In my 2nd hour, I barely had to speak as the students spoke to each other and had some fantastic discussion that accomplished exactly what I hoped it would. In my 4th hour, my students were much more hesitant to speak up. They are a naturally quieter group and had a lot less dialogue in the computer lab, so I think they would have benefitted from some pre-discussion in their lab groups and a little more structure, like Casey Rutherford’s Observations, Claims, & Evidence which I’ve used to frame most of the board meetings this year.

projectile graphs.jpg

Physical Science: Energy Types

We had some discussion about what seemed to be key characteristics of the energy types in yesterday’s simulation to form a basis for some definitions. I took a page from Modeling Instruction and defined potential energy as coming from interactions, then had some discussion about what constitutes an interaction. In the past, I’ve used stored energy as the definition for potential in 9th grade, but I like that interaction energy solidifies the connection between potential energy and forces.

energy-defs