Day 33: Friction & Moon Phases

AP Physics: Friction

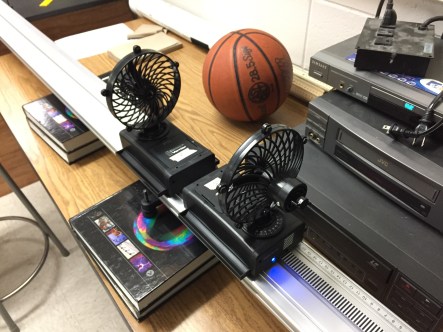
Students did a lab to determine which variables impact the magnitude of the force of friction. This lab provided some nice opportunities to talk about uncertainty and how big a difference is big enough to matter. Talking about the uncertainty also lead nicely into the fact that the model of friction on our equation sheet is actually pretty limited.

img_2410

Earth Science: Moon Phases

Students worked through a simple lab using a lamp, softball, and golf ball to model the Moon’s revolution around Earth and predict what phase of the moon would be visible at various positions. Students were very successful at connecting how much of the lit portion of the golf ball was towards the softball to what phase of the Moon would be visible from Earth.

img_2409

Day 32: Dueling Fan Carts & Climate Change

AP Physics: Dueling Fan Carts

I borrowed Frank Noschese’s dueling fan carts activity to reinforce the relationship between net force and motion. We had some good whole-class discussion about using system schema to determine which forces matter. My fan carts don’t produce exactly the same thrust, so there was some acceleration with combinations like high vs. high, but I was pleased at how quickly my students jumped to wanting to find a combination of settings where the forces did balance.

IMG_2404.JPG

Earth Science: Factors in Climate Change

We’ve done a lot of reading graphs and data tables related to climate change, but haven’t really had a chance to synthesize the observations. I used a slide deck that goes one factor at a time and uses actual data to give students the opportunity to determine the impact each factor has on climate. I envisioned this being very discussion heavy, but I was having trouble getting student input and it quickly became more of a lecture, I think in part because I kept students in their desks. I think next time I need to get them at lab tables using whiteboards to get them more actively engaged.

Day 30: Plickers & Ice Core Data

AP Physics: Plickers

I finally graded the first full-length test over the weekend and wanted to go over some of the questions students struggled with. I put the multiple choice questions that students got wrong most often into Plickers and had students vote individually, then discuss with other students, then vote again. There was a lot of great discussion along the way. In my 4th hour, I tried showing them the graph of responses after individual voting. That class came to a correct consensus less often than my 2nd hour where I kept the graph of individual responses hidden, but they also had much deeper conversations. I can’t decide how much of the difference I’d chalk up to the personality of each class and how much I think is a result of running the voting differently; I’ll probably experiment some more next time.

img_2398

Earth Science: Ice Core Data

Students used a graph of temperature changes, CH4 concentration, and CO2 concentration to look for patterns. It was clearly tricky for them to make sense of multiple data sets on the same set of axes, especially since there are three different vertical scales. The first question helped orient them to the horizontal axis, so I think I will add some scaffolding to explicitly focus them on the vertical axes before looking for patterns.

ice-core-graph

Day 29: Board Meeting & Hurricanes

AP Physics: Board Meeting

Students whiteboarded their results from the 2nd Law Lab and we had a board meeting. Students needed a reminder to translate the equation for their lines of best fit into “physics terms”, but they are getting more skilled at that. I was also pleased with how quickly students picked up on things like which groups had similar slopes, which made it easy to build some ideas like why the slopes would change.

img_2389

Earth Science: Hurricane Tracking

Students used some data from 1992’s Hurricane Andrew to plot its path and answer a few questions. They did a nice job connecting what they’ve learned about heat and wind so far to find some patterns in the hurricane’s path and wind speed, but the plotting took a long time. I’m debating whether I want to try and streamline the plotting next year so students can spend more time on the interpretation. It would be very easy to give them a completed map of the hurricane’s path, but I would need to revise or eliminate some of the questions where students paused their plotting to make predictions. Another option would be to put the map into Desmos as an image, then have students type in the coordinates. With the manual plotting, I overheard some conversations where students were connecting coordinates on the map to coordinates on a graph, which is a great connection for them to make and I can’t decide whether Desmos would help or hurt that connection. I also need to identify the key take-aways from this lab to help decide where I want students to spend their time.

Day 28: Modified Atwood’s & Project Wrap-Up

AP Physics: Modified Atwood’s Machine

Students used a modified Atwood’s machine to collect data for a relationship between force and acceleration. We spent some time unpacking that statement since I’ve found it really isn’t obvious to students what that means; last year, a lot of students really struggled to go from that statement to recognizing they needed to change the force and measure acceleration,

img_2383

Earth Science: Wind Turbine Wrap-Up

To conclude the wind turbine project, I gave students some information about an imaginary small farm and tasked them with selecting locations for three wind turbines and preparing a report for our “client” to justify their choice. Unfortunately, with the wind turbines and fans we have, it isn’t practical to set up both the topography and a trio of wind turbines for students to test their plans. Next year, I might try setting up a single, larger test area using a couple of our box fans so that we can have a big enough model for students to actually test their plan.

img_2358


Day 27: Elevators & Turbine Interference

AP Physics: Elevators

I showed students a video I made riding the elevator with a balance and asked them to determine whether the elevator was going up or going down and support their answer with free-body diagrams. I was pleased with how many groups started their conversation with “What’s our system?” I could tell from the conversations that a lot of students are still not entirely solid on the idea that an acceleration can be in the opposite direction of the motion, but thinking about the bowling ball lab from a few days ago seems to be helping. Next year, I want to do a better job of using the change in velocity arrows that show up in Etkina to help solidify the direction of acceleration.


Earth Science: Turbine Interference

In the next step towards designing a wind farm, students experimented with several turbines, comparing the amperage produced with different arrangements. This lab got my students asking some great questions that had me wishing that the trimester on physics came first rather than second this year. A lot wanted to know why the last turbine in a line wasn’t spinning, which is easy to explain with conservation of energy. A few others wanted to know what’s inside the turbine, which fits great with the build-a-motor lab we do in 9th grade physics. When we work on next year’s schedule, I’ll make sure to advocate for physics-earth-earth rather than this year’s earth-physics-earth sequence.

img_2336

Day 26: Defining Systems & Topography

AP Physics: Defining Systems

We played the mistakes game with yesterday’s free-body diagrams. In both my hours, there was some great discussion about a problem with a skydiver attached to a parachute and whether the upward force should be a tension force from the straps of the parachute or a normal force from the air on the parachute, which lead beautifully into the importance of defining your system.

IMG_2328.JPG

Earth Science: Topography & Wind

As the next stage of their project to plan a wind farm, students built a simple “topography” using textbooks and used simple flags to make observations about how that impacted wind speeds. Afterwards, students tried placing a turbine at some of the locations where they’d left flags and measuring the current produced.

img_2324

Day 25: FBDs & Wind Maps

AP Physics: Free-Body Diagrams

I gave a short lecture on the types of forces, then had students work on drawing some free-body diagrams. I’m being really picky about including the interaction when labeling forces this year (i.e. Fg (Earth on object)) which I’m hoping will pay off in deciding whether a force should be there as well as with the 3rd law. There were some great conversations about which forces need to be accounted for as well as what causes an object to move forward after the force is done.

Earth Science: Wind Maps

Students used some maps to look for a relationship between average wind speeds and topography. Then, they picked what locations in Minnesota might make sense for a wind farm. This lead to some good conversations about trade-offs in engineering, such as why  there are some wind farms near big cities, even in parts of the state with relatively slow average wind speeds.

wind-turbine-map

Day 24: Bowling Balls & Problem Scoping

AP Physics: Bowling Balls

Students did a lab I borrowed from Frank Noschese hitting bowling balls with rubber mallets to look for a relationship between force and acceleration. I really like the conversations that happen when students are working out how to get a bowling ball to move at a constant velocity. When one group was wondering how to check, we ended up pulling out the Motion Shot app to make a motion map. Another group decided they needed to use gentle forward taps to maintain the constant velocity combined with even gentler backwards taps to counteract the forward ones; as they made their taps gentler and gentler, they eventually realized they could do away with them entirely. My 4th hour also got very excited about balancing things on their bowling balls.


Earth Science: Problem Scoping

On Thursday, students only had time to answer the problem scoping questions individually. Today, I had them answer the questions with their lab groups using a different colored pencil to differentiate individual ideas from group ideas. After that, we discussed as a class what kinds of things students will need to know for the engineering design challenge, which lead nicely into introducing and previewing the learning targets for the unit.

Day 23: Test & Problem Scoping

AP Physics: Test

I use standards-based grading and this year, I’m giving each student two scores on each standard. What I’m calling the tier 1 score is from an assessment similar to what I gave in honors physics and the tier 2 score is from a full-period test with problems modeled on the AP Physics 1 exam. Today was the first tier 2 test. I’m not very focused today, so I spent too much time playing with a solution I made in Desmos to one of the multiple choice problems.

Earth Science: Problem Scoping

We’re starting a unit on wind that includes an engineering design challenge to plan a wind farm, so I decided to take a project-based learning approach to this unit. Today, I introduced the design challenge using a problem scoping process I picked up at EngrTEAMS. Students read a short memo from our “client”, then wrote individual answers to some questions about the specifics of the design challenge. We ran out of time for students to meet with their groups, so on Monday, they’ll share those answers in their groups and record a group answer in their notebook alongside the individual answers.