This week, we came back from spring break and started trimester 3.
Physics: Energy Bar Charts
This week we focused on drawing energy bar charts. Students have struggled to connect representations, so I tried starting by having students draw the more familiar energy pie charts. Then, we got out the Mathlink cubes to use as a manipulative representing the types of energy (an idea I think I first saw in Scott Hertting’s article in The Physics Teacher). Once students had rearranged the cubes to represent at least two different snapshots, I had them sketch how they arranged the cubes on a bar chart. One thing I was really excited about is as the week progressed, I had some students ask if they could keep using the cubes, which tells me they were a useful tool. I also saw a lot of students sketching energy pie charts to help figure out what the bar charts should look like, which tells me they are connecting the two representations when seeing relationships between representations has been really challenging this year.

AP Physics: Oscillating Springs
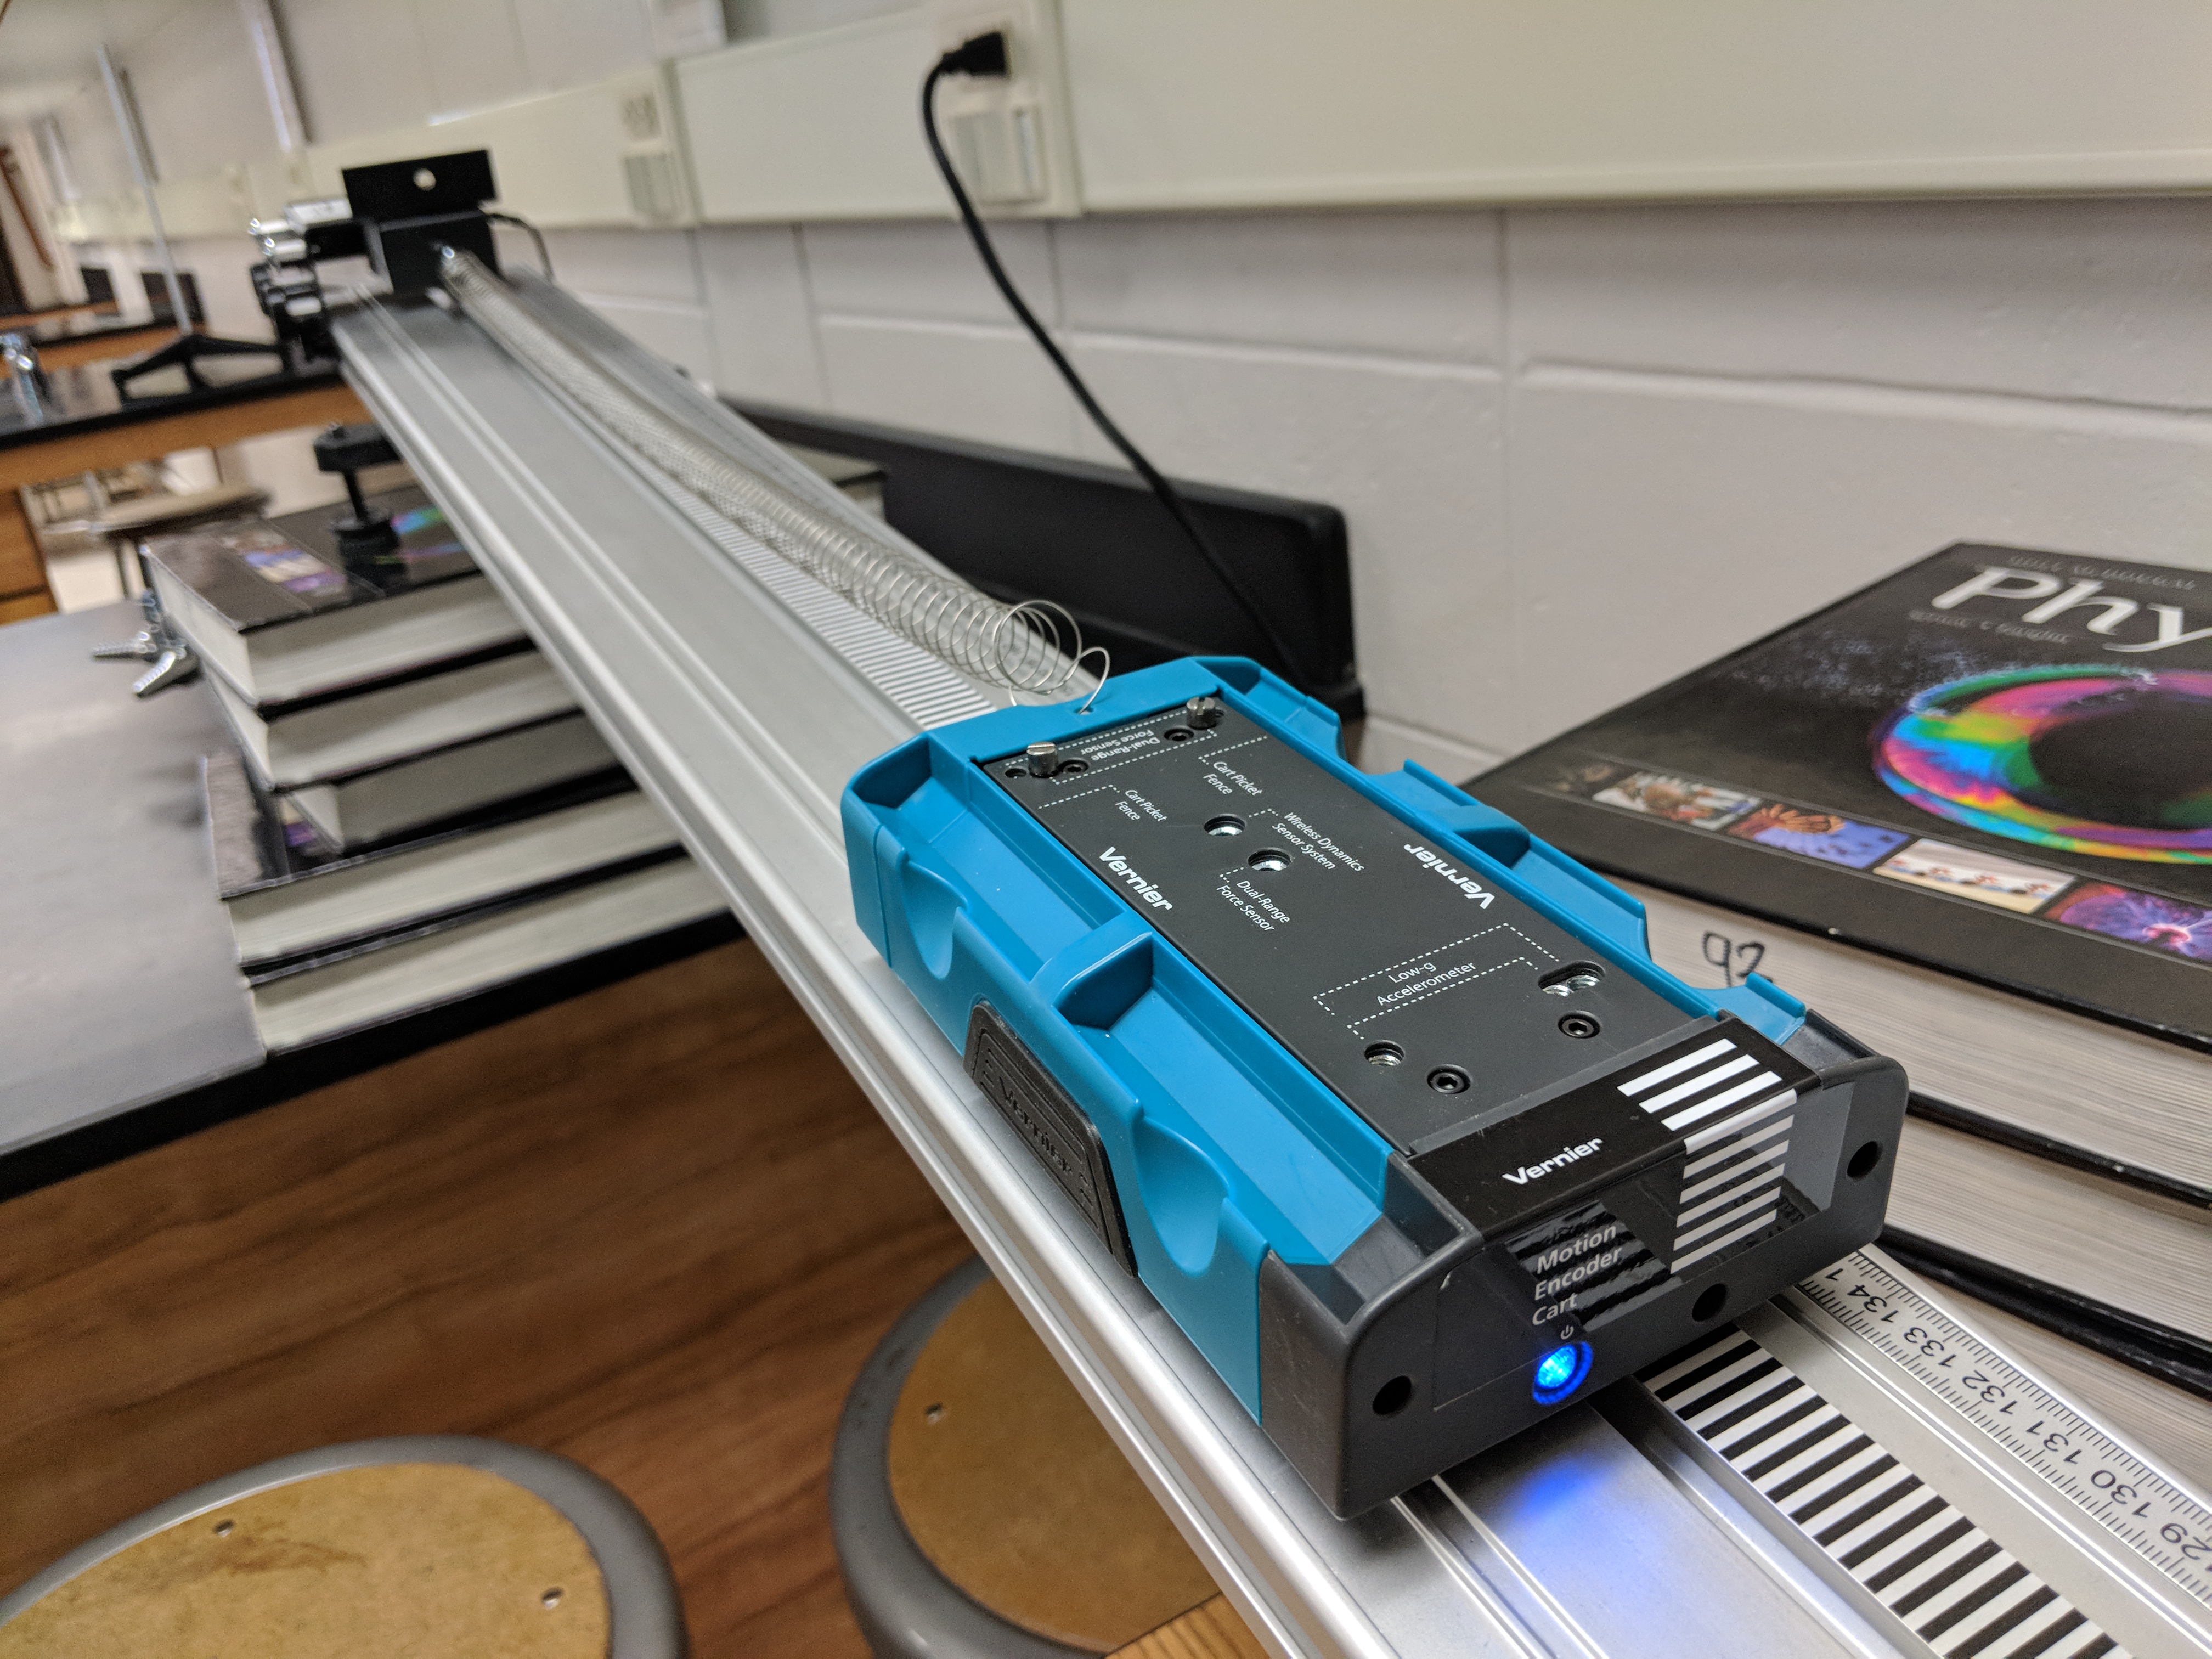
Students did a lab to find the equation for the period of a spring, then we dove into some problems. Students did really well with the problems focused on representations and showed a lot of growth from earlier this year on the problems from the College Board’s AP Physics 1 workbook. The workbook problems included a lot of predictions about how various factors would affect the period of a spring, so we used a spring to connect a motion encoder cart to a force sensor on a track so we could change the angle the spring was at, as well as factors students had already tested like mass and amplitude. I also made sure to use this as an opportunity to review some basics on motion graphs since exam day is starting to loom.