AP Physics 1: Spring Force
Students collected data for a relationship between the force on a spring and how much it stretches. I have them collect data for at least two different springs hanging vertically, then pick a spring where they also collect data by pulling it horizontally. I love the moment when groups call me over because something is “wrong” with their graphs because the line for when the spring is vertical matches the line for when the spring is horizontal.

Physics: Annotating Graphs
As a stepping stone to graphical solutions for constant acceleration, students worked on annotating velocity vs. time graphs and building equations from the slope and intercept. Last year, this was really tough, so I changed some of the language I used to try and connect the annotations to the visible features of the graph a little more clearly, and it seemed to click for a lot of students.

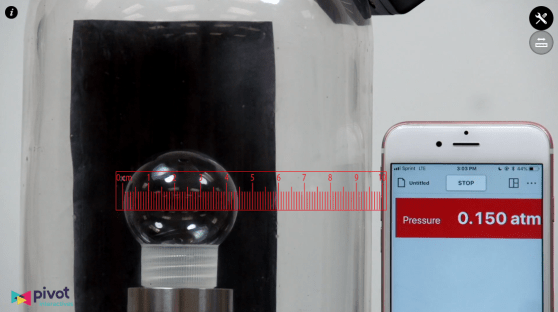
Chemistry Essentials: Pressure & Volume
I am being compensated by Pivot Interactives for participating in a pilot of their chemistry materials.
Students used another Pivot Interactives activity. This one used a bubble in a vacuum chamber to allow students to find a relationship between pressure and volume. In a previous lab on volume, finding the volume of a cylinder was a big hurdle for a lot of my students, so it was really nice for them to be able to use the tools in Pivot to do that number crunching without getting hung up on the math.

Pingback: Day 23: Board Meeting, Annotating Graphs, & Gas Laws | stoeckel180