Physical Science: Interpreting Motion Graphs
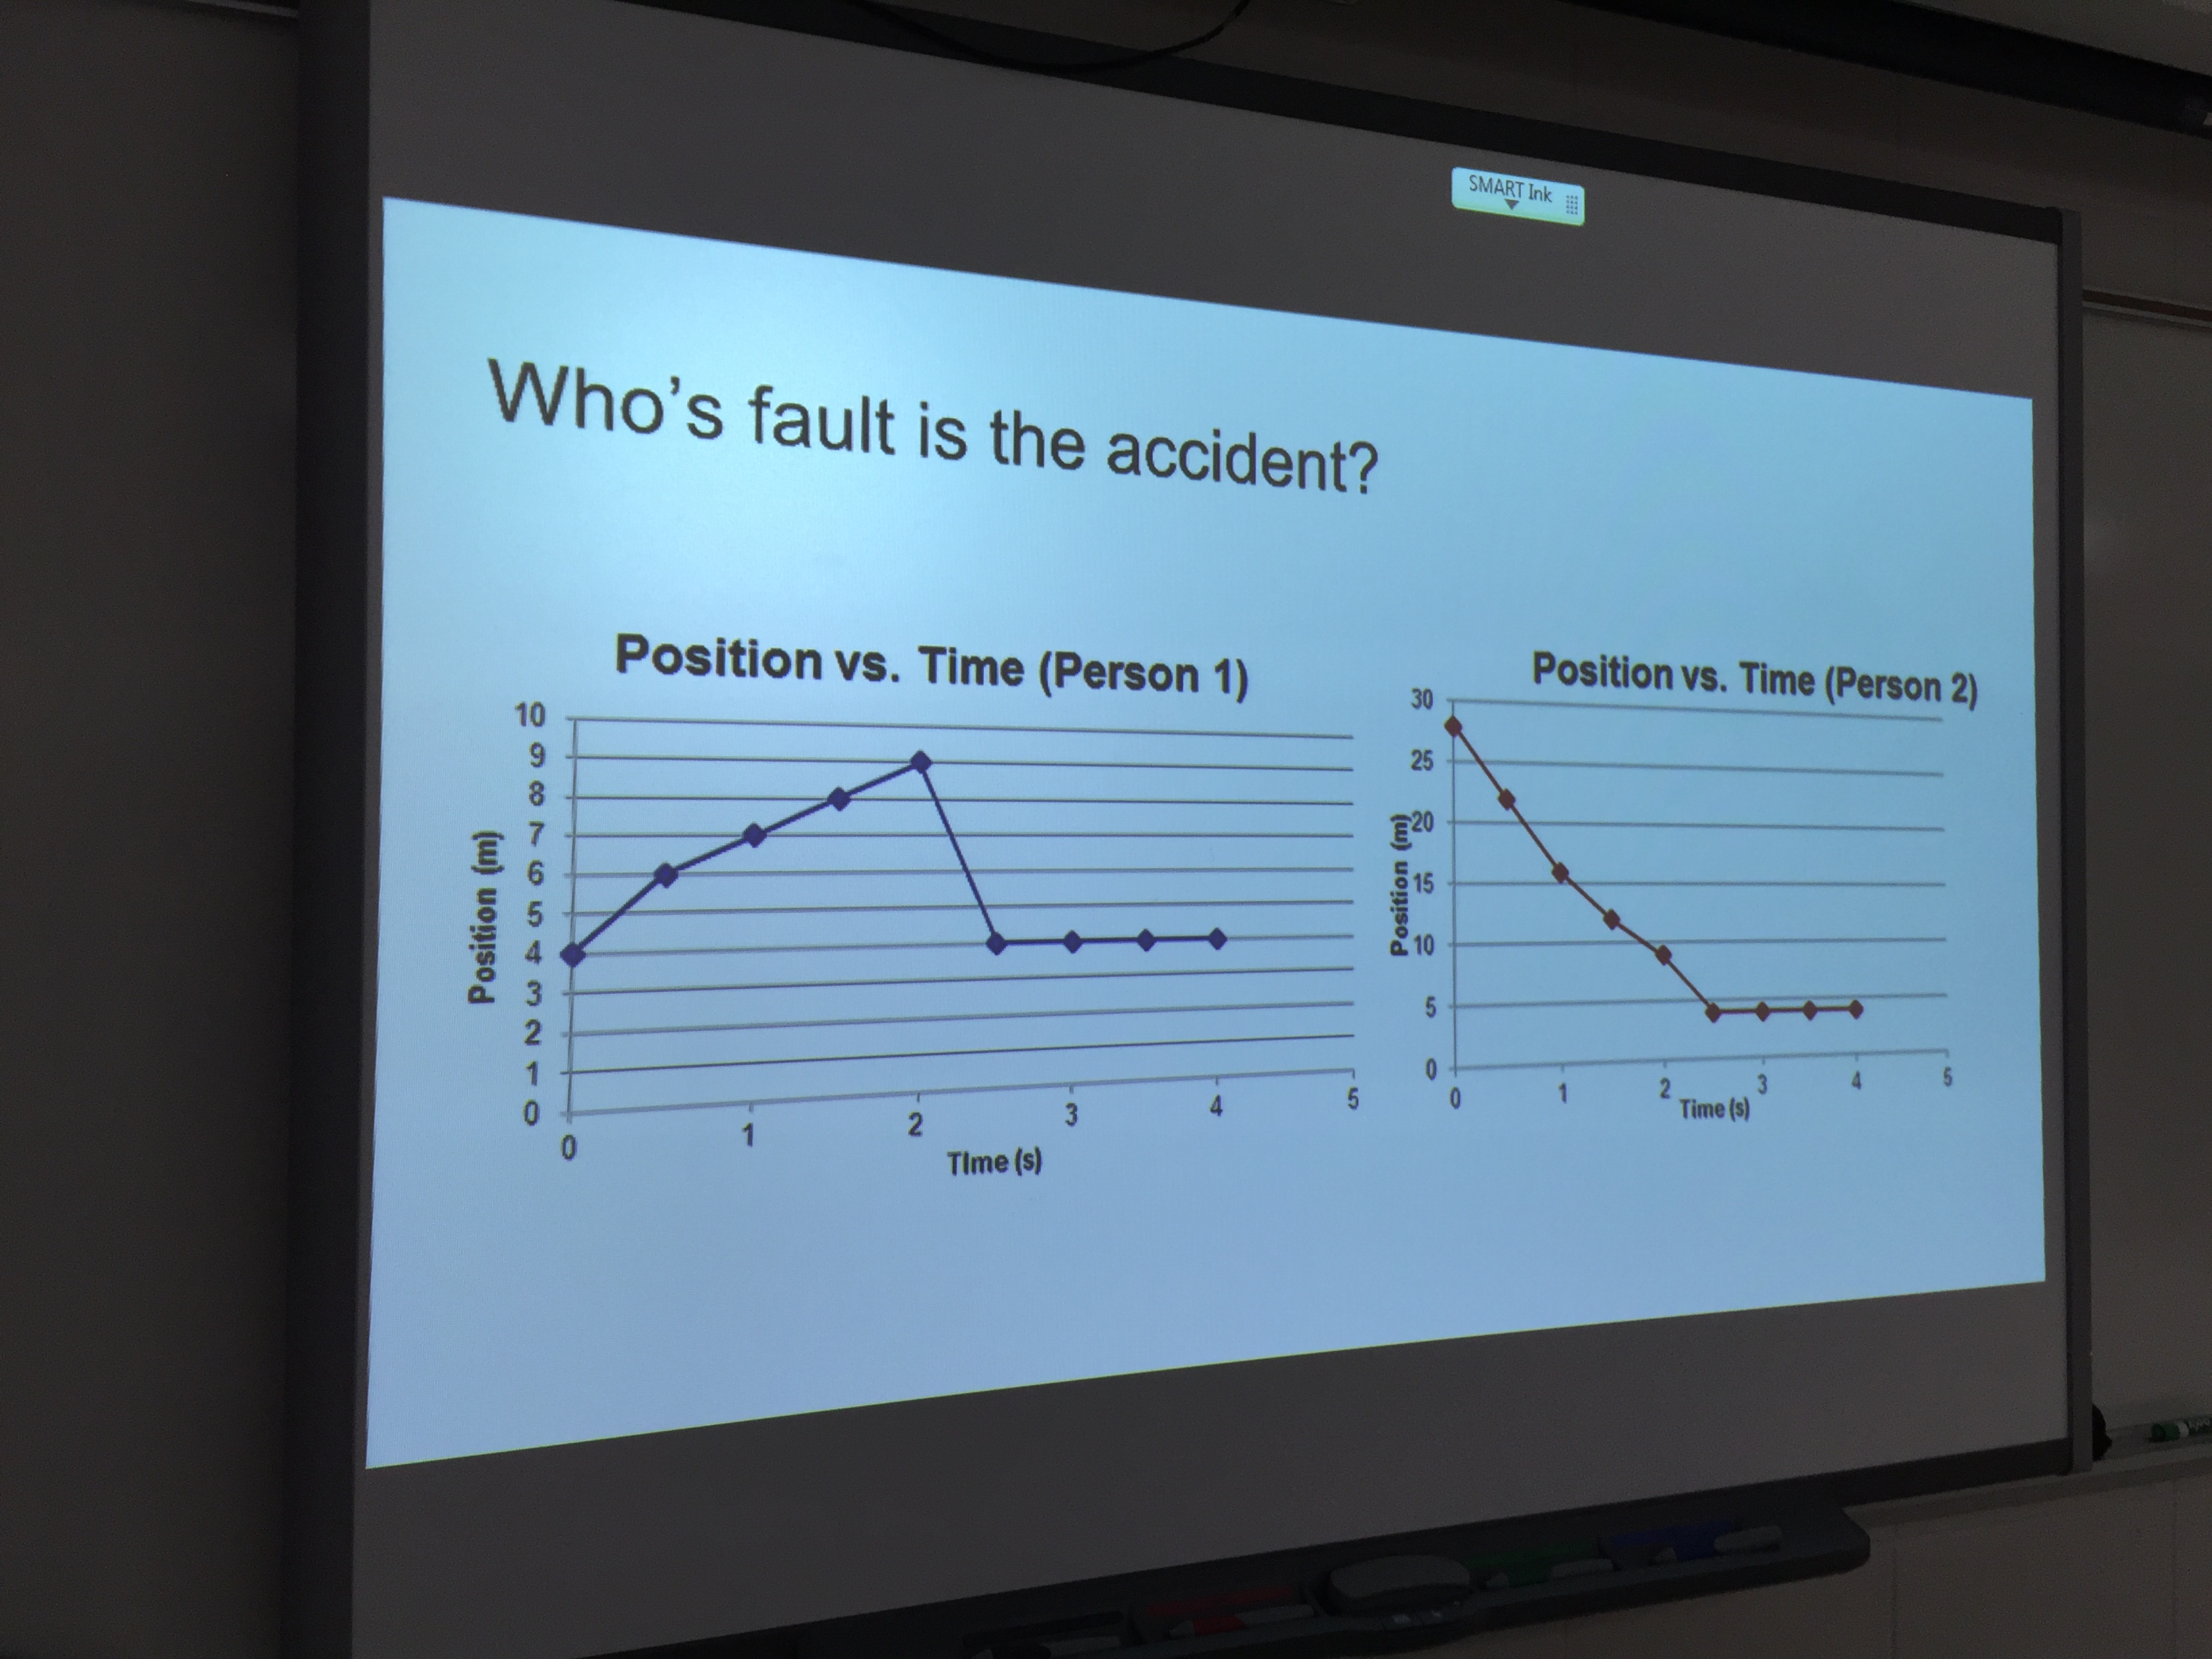
To wrap-up the unit on motion, I used an activity from the 2014 EngrTEAMS summer institute at the University of Minnesota. Given position vs. time graphs for two cyclists, I first had them identify when they collided. Next, students had to decide who was at fault and construct an argument based on the graphs. There was a wide range of answers that used a lot of different evidence from the graphs, which is exactly what I was hoping for.
Physics: Graphical Solutions
Now that students have a pretty good handle on velocity vs. time graphs, they took their first stab at solving problems using graphical solutions. By the end of the hour, most students seemed pretty comfortable with this approach. I’m sure it helped that our AP Calculus teacher has students do quite a few kinematics problems and uses graphical solutions as a stepping stone to integrals. Its almost like physics and calculus are related!

