Day 13: Whiteboard Prep & Greenhouse Effect

AP Physics: Whiteboard Prep

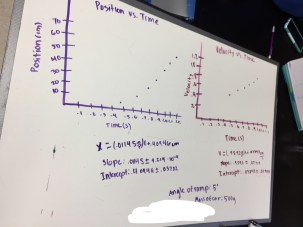
We finally finished data collection on the ramp lab; using the dynamics tracks and the LabQuests for the first time along with working through uncertainty took longer than I expected. Students also prepped their whiteboards today, so tomorrow we can start by talking through the results.

IMG_2232.JPG

Earth Science: Greenhouse Effect

Students did a lab to compare heating in a covered and uncovered beaker as an analogy for the greenhouse effect. We had some great discussion beforehand about what needed to be controlled in this experiment. While there were some good contributions, they came from a limited number of students, so I may try randomly calling on some students after they’ve had a chance to think independently and talk to a neighbor the next time we look at something like this.

img_2231

Day 12: Linearization & Heating

AP Physics: Linearization

Most students finished their position vs. time graphs, so we took some time to talk about linearization. I really like the ways that uncertainty played into the discussion. In particular, students were quick to recognize that the line of best fit doesn’t go through the error bars and that the intercept is much further from 0 than the uncertainty. This motivated nicely that, even though the line had a good r2 value, it wasn’t good enough.

ramp-lab-graph

Earth Science: Heating

Students placed thermometers at different angles in front of a lamp to simulate the sun striking the surface of the earth at different angles. I like that this lab starts with a question, namely  “Why is it hotter at the equator?” Next time, I’d like to involve students in more conversation about how we can model that in the lab since I think many lost the connection between the question and the data they were collecting.

Day 11: Photogates & Atmosphere

AP Physics: Photogates

To introduce constabt acceleration, students used photogates to collect data for position vs. time and velocity vs. time graphs for a cart on a ramp. A lot of students were a little intimidated by the LabQuests at first, but, by the end of the hour, they declared my decision to get probeware instead of textbooks was the right one.


Earth Science: Layers of the Atmosphere

Students plotted altitude vs. temperature for Earth’s atmosphere, which lead nicely into the different layers. Some students were bothered by the fact that their graph didn’t pass the vertical line test for a function, so we had some discussion about the different purposes a graph can serve and why it might make sense to sometimes break certain rules.

Day 9: Board Meeting & Review

AP Physics: Board Meeting

Students sketched their distance vs. time and angle vs. time graphs from the rotating disk Direct Measurement Video. I’d assumed students would just use the frames displayed in the video to find the time directly, but a lot of groups decided to treat when a dot was at a position of zero as t = 0, which gave us a good opportunity to talk about some experimental design decisions, which reinforced what the intercept represents on a graph like this.


Earth Science: Review

As a school, we’ve been working on having students write meaningful questions as part of our focus on Cornell notes. While I don’t do many notes, I decided to piggy back on this by having students write possible test questions for each learning target. Periodically, I had groups trade whiteboards and work on answering the questions another group had come up with. At this point, the questions were fairly superficial, which isn’t surprising since we just skimmed the surface of the topics in this unit and students haven’t had much practice or feedback writing questions yet.

Day 8: Dueling Buggies & Tides

AP Physics: Dueling Buggies

We finished up the dueling buggies lab practical today. We also talked a little about what it means for a given approach to be “better”.

img_2211

Earth Science: Tides

I gave students a one-month tide chart for Olympic National Park and had them look for patterns. I really like that their tide charts include the moon phases, so my students were making some connections between the biggest changes in the tides and the phase of the moon. We also talked about how to make sure the patterns were valid, which lead to looking at the tide charts for some additional months.

Day 7: Angular Velocity & Currents

AP Physics: Angular Velocity

I’ve decided to try embedding circular motion with kinematics, rather than introducing it as a separate unit, so today I introduced constant angular velocity. Students used a Direct Measurement Video of a rotating disk to plot both angle vs. time and distance vs. time for dots at different radii. I also introduced them to doing calculations in a spreadsheet since some of the number crunching they needed to do could be repetitive. Spreadsheets, high speed video, and some new physics was a lot to take in at once, so I gave more structure than usual, and my students rolled with it well.

rotating-disk-dmv

Earth Science: Currents

Students prepped whiteboards with their conclusions to yesterday’s lab using the claim-evidence-reasoning framework. Students seemed excited to share their work with the class. Afterward, we made some connections to ocean currents.

IMG_2184.JPG

Day 6: Dueling Buggies & Currents

AP Physics: Dueling Buggies

We finished discussing the whiteboards students prepped yesterday, then students started working on the dueling buggies practical, where they must predict the position where a pair of buggies will collide given their starting position. My favorite moment was when a student was explaining his approach to his group, and I realized he’d come up with relative velocity. One student asked if he could cheat and just graph the lines and find the intersection, so we talked about the fact that using tools from class on a problem in class is never cheating 🙂 A lot of groups asked me if they were taking the “easiest” approach, so I want to plan some time to talk about what that means when we test their answers on Thursday.

Earth Science: Currents

Students designed experiments to look at how water temperature or salinity drive currents. Students embraced designing their own experiments and it was a lot of fun listening to them discuss how density and other concepts from middle school connect to the lab. Before the lab, I asked them about what makes a good experiment. My students listed things like a procedure, that they’re often asked to turn in, and pieces like a hypothesis that are steps of the “classic” scientific method. I want to keep revisiting this during the trimester to move them towards deeper characteristics of a good experiment.

img_2181


Day 5: Lab Group Contracts & Branches of Earth Science

AP Physics: Lab Group Contracts & Mistakes Game

We started by talking about some of the skills that highly effective lab groups tend to demonstrate. From there, I asked each lab group to write a short contract for themselves they could use to help develop those skills and hold each other accountable. Most of the contracts are fairly broad or vague, I think because I was vague about what I wanted, but groups had some good conversations about their strengths and weaknesses. My favorite item is the group that agreed to “criticize everything.”

After that, students got their first taste of the Mistakes Game. I started by using a recent cooking disaster to discuss the value of examining mistakes, rather than ideal solutions, then introduced the mistakes game. Students readily embraced this approach; I spoke less and heard better questions than much later in the year last year.

img_2177

Earth Science: Branches of Earth Science

Students attempted to answer the question “what is earth science?” I asked each group to make a visual representation of their answer, including something to indicate the four main branches of the field. Students worried about their artistic abilities at first, but ended up getting into it. I had them use whiteboards, and it was great to see groups really talk to each other instead of each disappearing into their own papers.

img_2176


Day 4: Board Meeting & Earth’s Spheres

AP Physics: Board Meeting

We discussed the buggy lab today for our first board meeting of the year. I followed Casey Rutherford’s Observations, Claims, Evidence framework and my students were eager to dive in, but I think they didn’t know enough about what other groups did really dig into some of the discussion points. I usually just have students put their graph and equation on the whiteboard in an effort to make it readable by 30+ people, but I want them to share more about their experimental design next time and am toying with a couple ideas. I’m leaning towards either doing a gallery walk prior to the whiteboard discussion, so that we can sacrifice some readability in favor of more information on the whiteboards, or getting a few more whiteboards so that groups can have one for results and one for the set-up of their experiment. I thought about starting the discussion with each group giving a 1-2 min description of their experiment, but I worry with 8-12 lab groups in a class, that will be too much information to keep track of.

Earth Science: Earth’s Spheres

Students did a foldable interactive notebook activity to compare the biosphere, atmosphere, geosphere, and hydrosphere. I think both my students and I were a little frustrated to set aside the really good thinking they’ve done on ocean currents the last few days to work on something that didn’t feel connected. I’m teaching in a colleague’s classroom and following his sequence, in large part because we only have one class set of lab equipment and multiple sections of the course every period, so scheduling labs gets tricky, but I need to work around that to give my class more sense of coherence.

img_2165

Day 3: Uncertainty & Ocean Currents

AP Physics: Uncertainty

I did a short lecture on uncertainty (I know, ugh, but I didn’t have any bright ideas for a better approach), then students figured out the uncertainty on their buggy lab measurements and prepped whiteboards. Tomorrow, as we dig deeper into the physical meaning of the graphs, we’ll translate the equations for the lines into physics-speak.

buggy-whiteboard

Earth Science: Ocean Currents

Students made some observations of a video of convection currents in a tank of water, then worked on combining those observations with a map of ocean temperatures and what they know about the Coriolis Effect to predict what the major ocean gyres should look like.

img_2152-1